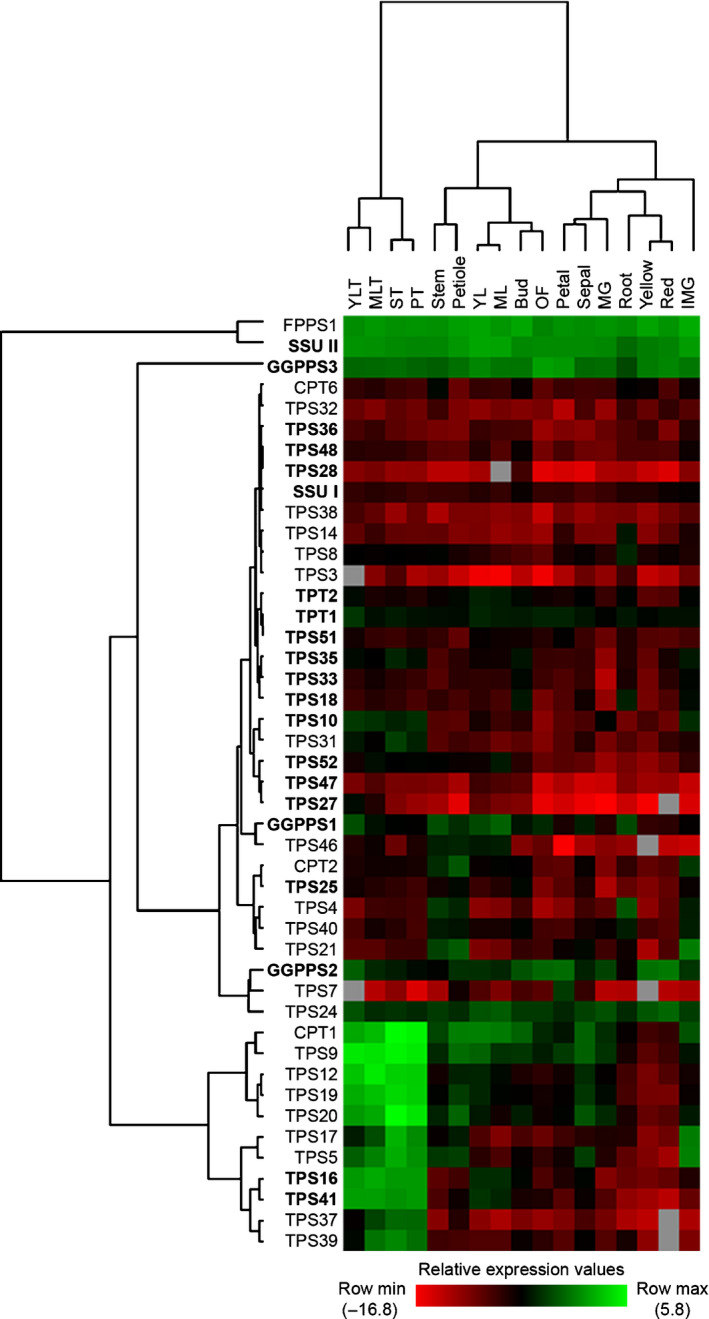
Figure 9.

Gene expression analysis of terpene metabolism‐related genes. Heat map showing the relative transcript abundance of terpene synthase and prenyltransferase genes from tomato plant tissues taken at different developmental stages. Genes functionally characterised in this work are shown in bold. The values in the colour bar are log‐transformed values of relative transcript levels (2−∆Ct) determined by quantitative real‐time PCR (RT‐qPCR), grey colour indicates missing of transcript reads. The hierarchical clustering was performed using average linkage method by cluster 3.0. Abbreviations for tissues: IMG, immature green fruit; MG, mature green fruit; ML, mature leaf; MLT, mature leaf trichome; OF, fully opened flower; PT, petiole trichome; ST, stem trichome; YL, young leaf; YLT, young leaf trichome. Abbreviations for genes: CPT, cis‐prenyltransferase; FPPS, farnesyl diphosphate synthase; GGPPS, geranylgeranyl diphosphate synthase; SSU, small subunit of geranyl diphosphate synthase; TPS, terpene synthase; TPT, trans‐prenyltransferase.
