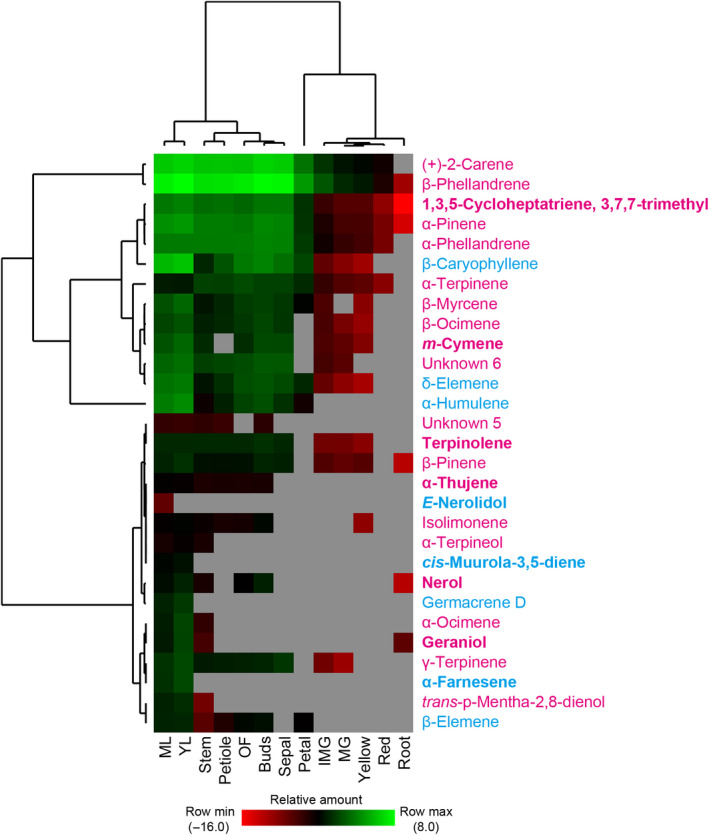
Figure 10.

Terpene profiles of different tomato tissues. The peak areas normalised to the internal standard and tissue wet weight were calculated for each of the 29 terpene signals in 13 tomato tissues. Mass spectra and retention indices of the terpene products can be found in Supporting Information Fig. S3; Table S2, respectively. The average from two to three replicates was calculated and log‐transformed for the construction of heatmap. Grey colour indicates undetectable. The hierarchical clustering was performed using average linkage method by cluster 3.0. Monoterpenes are shown in magenta and sesquiterpenes are shown in blue. New terpenes identified in this work are shown in bold. IMG, immature green fruit; MG, mature green fruit; ML, mature leaf; OF, fully opened flower; YL, young leaf.
