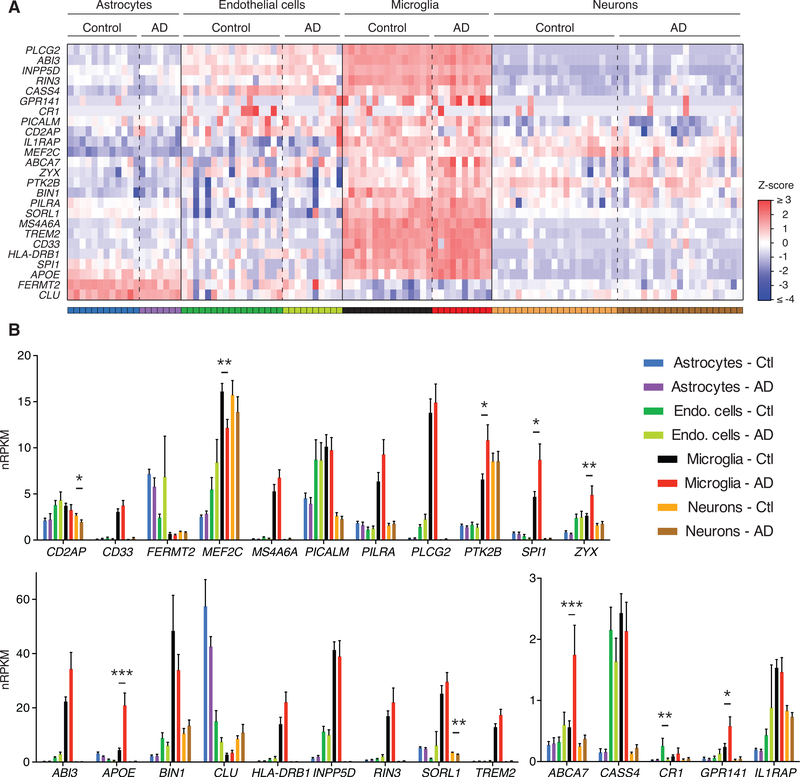
Figure 2. Sorted Cells from Frozen Human SFG Specimens Exhibit Preferential Expression of Many AD Risk Genes in Microglia.
(A) Heatmap of Z scores for each AD risk gene’s normalized reads per kilobase gene model per million total reads (nRPKM) expression value in each sample, with a sample’s Z score for a given gene representing its distance in standard deviations from the mean expression value across all samples for that gene. Gene selection was informed by genome-wide association study (GWAS) reports (Hollingworth et al., 2011; Lambert et al., 2013; Naj et al., 2011; Ramanan et al., 2015; Sims et al., 2017) and specific efforts to identify causal genes in GWAS-identified loci ( Huanget al., 2017; Novikova et al., 2019; Rathore et al., 2018).
(B) Expression values are plotted for each AD risk gene in each cell type sorted from frozen SFG of controls (Ctl) or AD patients. Bars and lines represent mean expression ± SEM, with asterisks marking DE in AD versus control cells based on unadjusted DESeq2 p values (*p < 0.05, **p < 0.01, ***p < 0.001).

