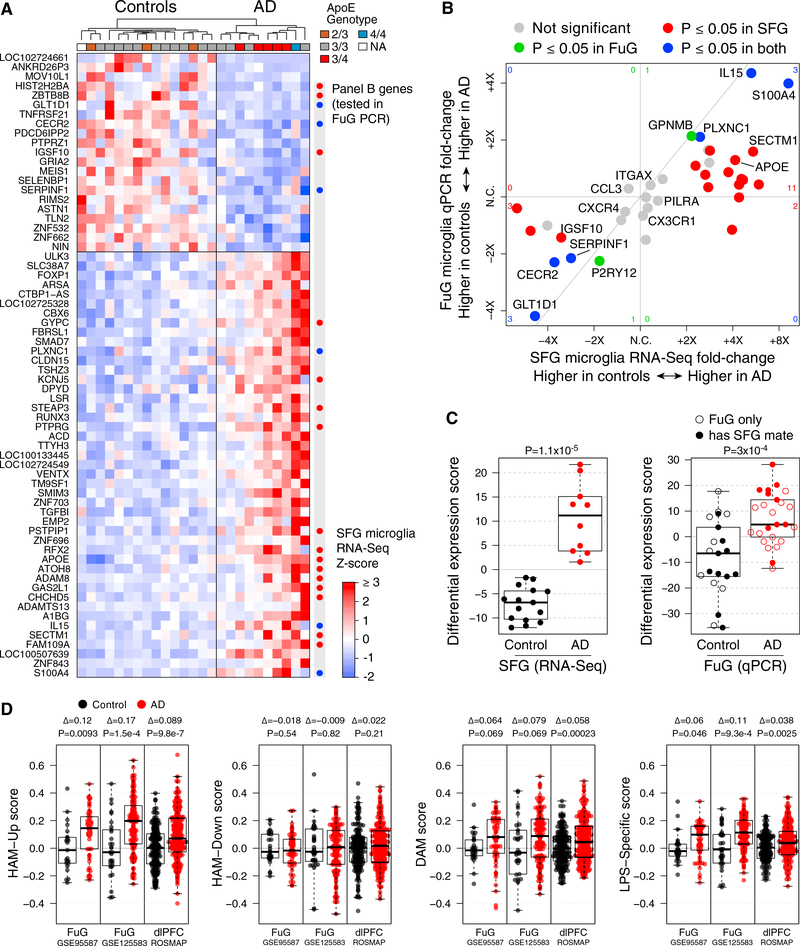
Figure 3. Human Microglia Exhibit an AD-Associated DE Profile in Both Frontal and Temporal Cortices.
(A) Heatmap of AD DE genes (rows; DESeq2 adjusted p ≤ 0.05 and maximum Cook’s p ≥ 0.01) in control and AD SFG-derived microglia expression profiles (columns, sorted by AD-associated DE). “Panel B genes” indicates genes that were subsequently assayed by qPCR in microglia sorted from FuG tissues, with colors from (B).
(B) 4-way comparison of AD-associated DE in SFG microglia measured by RNA-seq (x axis) with DE in FuG microglia measured by qPCR (y axis). Each point represents one gene colored by whether the adjusted p value was ≤ 0.05 in one or both DE analyses (red for SFG RNA-seq, green for FuG qPCR, or blue for both). Corresponding numbers of DE genes are shown near the borders of the plot. For example, the red 11 on the right reflects the number of genes that were significantly up in SFG and trended up but did not meet significance in FuG, whereas the blue 3 at the top right indicates the number of genes significantly upin both regions. Genes were selected manually for validation, consisting of about 1/3 of the DE genes from the RNA-seq study and several other cell-type markers and genes of interest. Diagonal line: y = x. (See Figure S3A for subject-wise SFG-FuG microglia DE correlations, Figure S3B for selected qPCR data plots, and Data S2 columns EK–GH for qPCR expression statistics for all 39 genes in the panel.)
(C) SFG microglia DE is reproduced in FuG microglia. DE scores (see STAR Methods) are shown for each SFG and FuG microglia sample, using the 22 SFG DE genes that were included in the qPCR panel. For FuG microglia samples, open circles indicate that a QC-passing SFG RNA-seq microglia profile was not available from that subject. p value, t test.
(D) Detection of upregulated HAM profile genes is recapitulated in myeloid-balanced whole AD tissues from frontal and temporal cortical regions and is more robust than DAM changes predicted by mouse microglia profiles. Each study was separately myeloid balanced to create a subset of whole-tissue samples with similar myeloid gene set scores, and neuronal genes were removed from each gene set. (See Figure S4C for division by Braak stage with all samples and all genes included.) Each panel shows gene set scores for the indicated gene sets for each of the myeloid-balanced AD or control samples. Δ, mean log2 fold change; p value, t test.

