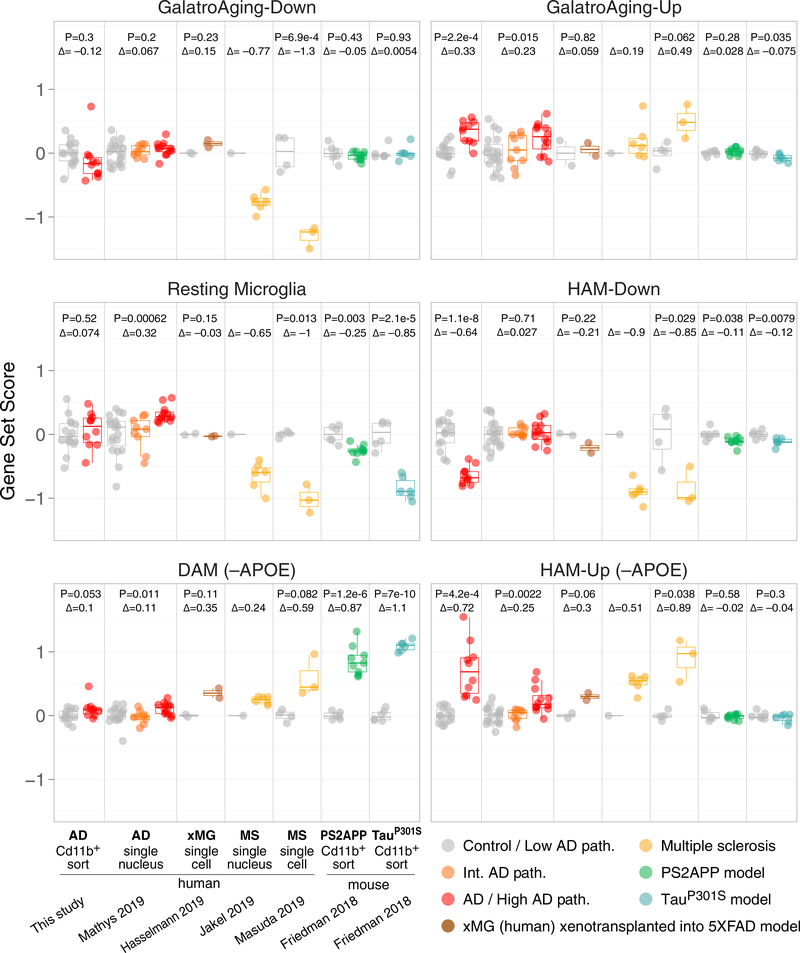
Figure 7. HAM Signature Is Elevated in Multiple Neurodegenerative Settings, whereas DAM Response Is Weaker in AD Microglia.
Control-centered scores (log2 scale) for the indicated gene sets were calculated for each sample in the indicated datasets. For snRNA-seq datasets (Mathys et al., 2019, frozen AD tissues, syn18485175; Jä kel et al., 2019, frozen MS tissues, GEO: GSE118257) and scRNA-seq datasets (Masuda et al., 2019, freshly resected MS lesions, GEO: GSE124335; Hasselmann et al., 2019, human induced pluripotent stem cell [iPSC]-derived xMG into 5xFAD mouse brains, GEO: GSE133433), each datapoint represents a pseudobulk microglia profile from pooling individual nuclei/cells from a given subject. (See Data S4, panels 2 and 3, for definitions of microglia clusters used to generate pseudobulk profiles from sn/scRNA-seq datasets.) Other datasets are bulk-sorted brain myeloid cells from frozen AD tissues (this study, GEO: GSE125050) or fresh mouse model tissues (PS2APP b-amyloid and PS19 Tau-P301S models, GEO: GSE89482 and GSE93180). D, log2 fold change of group means; p values from t test. For syn18485175, t test and D were between low- and high-pathology groups. The p value was omitted for GEO: GSE118257, because only one control sample was available (see STAR Methods). See STAR Methods (Gene Set Analysis section) for gene lists and Figure S7 for depictions of individual DE genes across studies.

