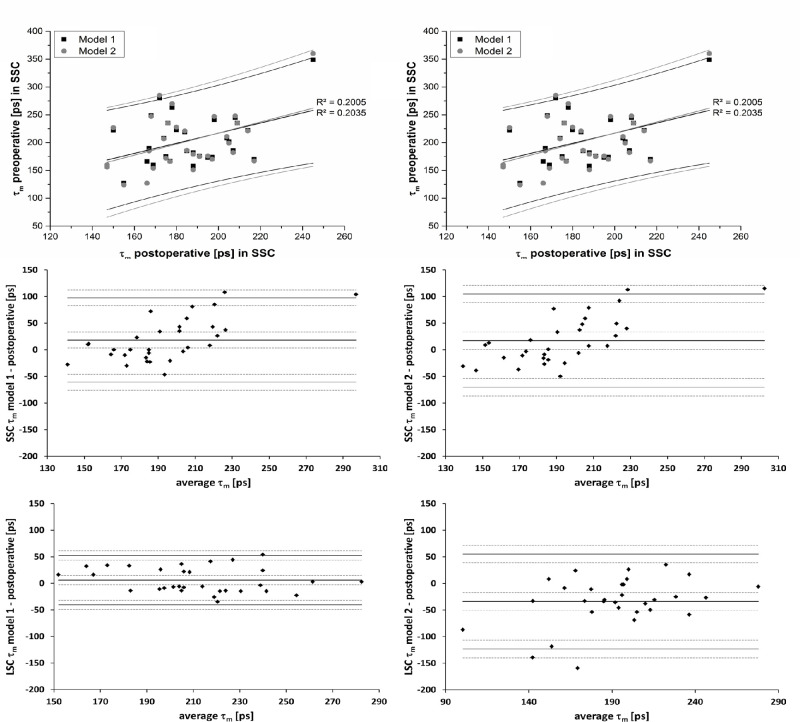
Figure 4.
Correlation between postoperative and preoperative (models 1 and 2) mean lifetimes (τm) in the SSC (top left) and LSC (top right) for the full circle of the ETDRS grid along with Bland–Altman plots of the differences of τm between both preoperative models and the postoperative measurement for the SSC (middle) and LSC (bottom). Dashed lines indicate 95% confidence intervals for the limits of agreement.

