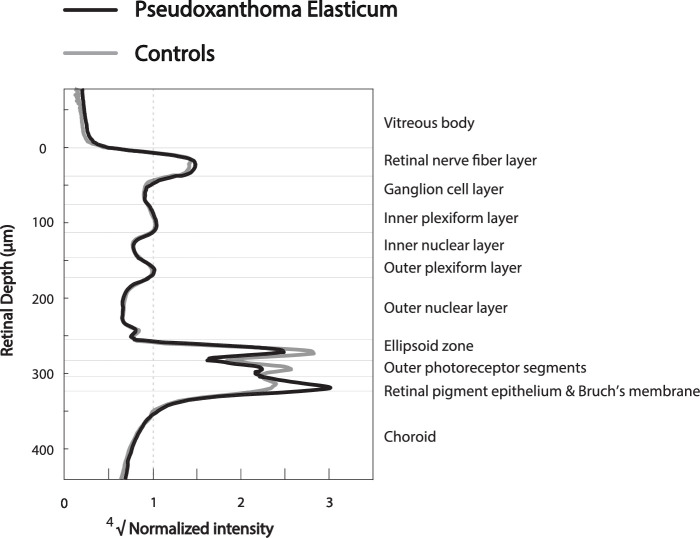
Figure 1.
Reflectivity profiles of patients with PXE and controls. Averaged reflectivity profiles of patients with pseudoxanthoma elasticum (PXE) (n = 45) and controls (n = 25). The normalized reflectivity is plotted against the retinal depth. On the right side, the corresponding retinal layers are noted. The GCL-IPL layer was used as the reference layer for normalization. The fourth root of the normalized reflectivity was used for better visualization.

