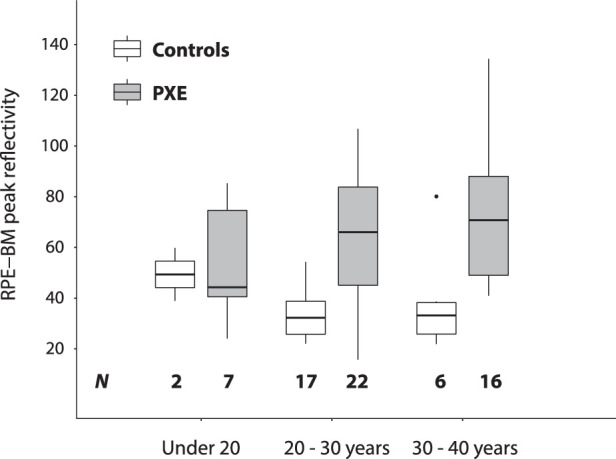
Figure 3.

The effect of age. RPE-BM peak reflectivity of patients with PXE and controls, plotted by their age category. The RPE-BM reflectivity is normalized to the GCL-IPL layer. The horizontal bars represent the median value, and the boxes represent the interquartile range. Per person, the reflectivity values were averaged. The number of patients per category is listed at the bottom of the figure.
