
Figure 1.
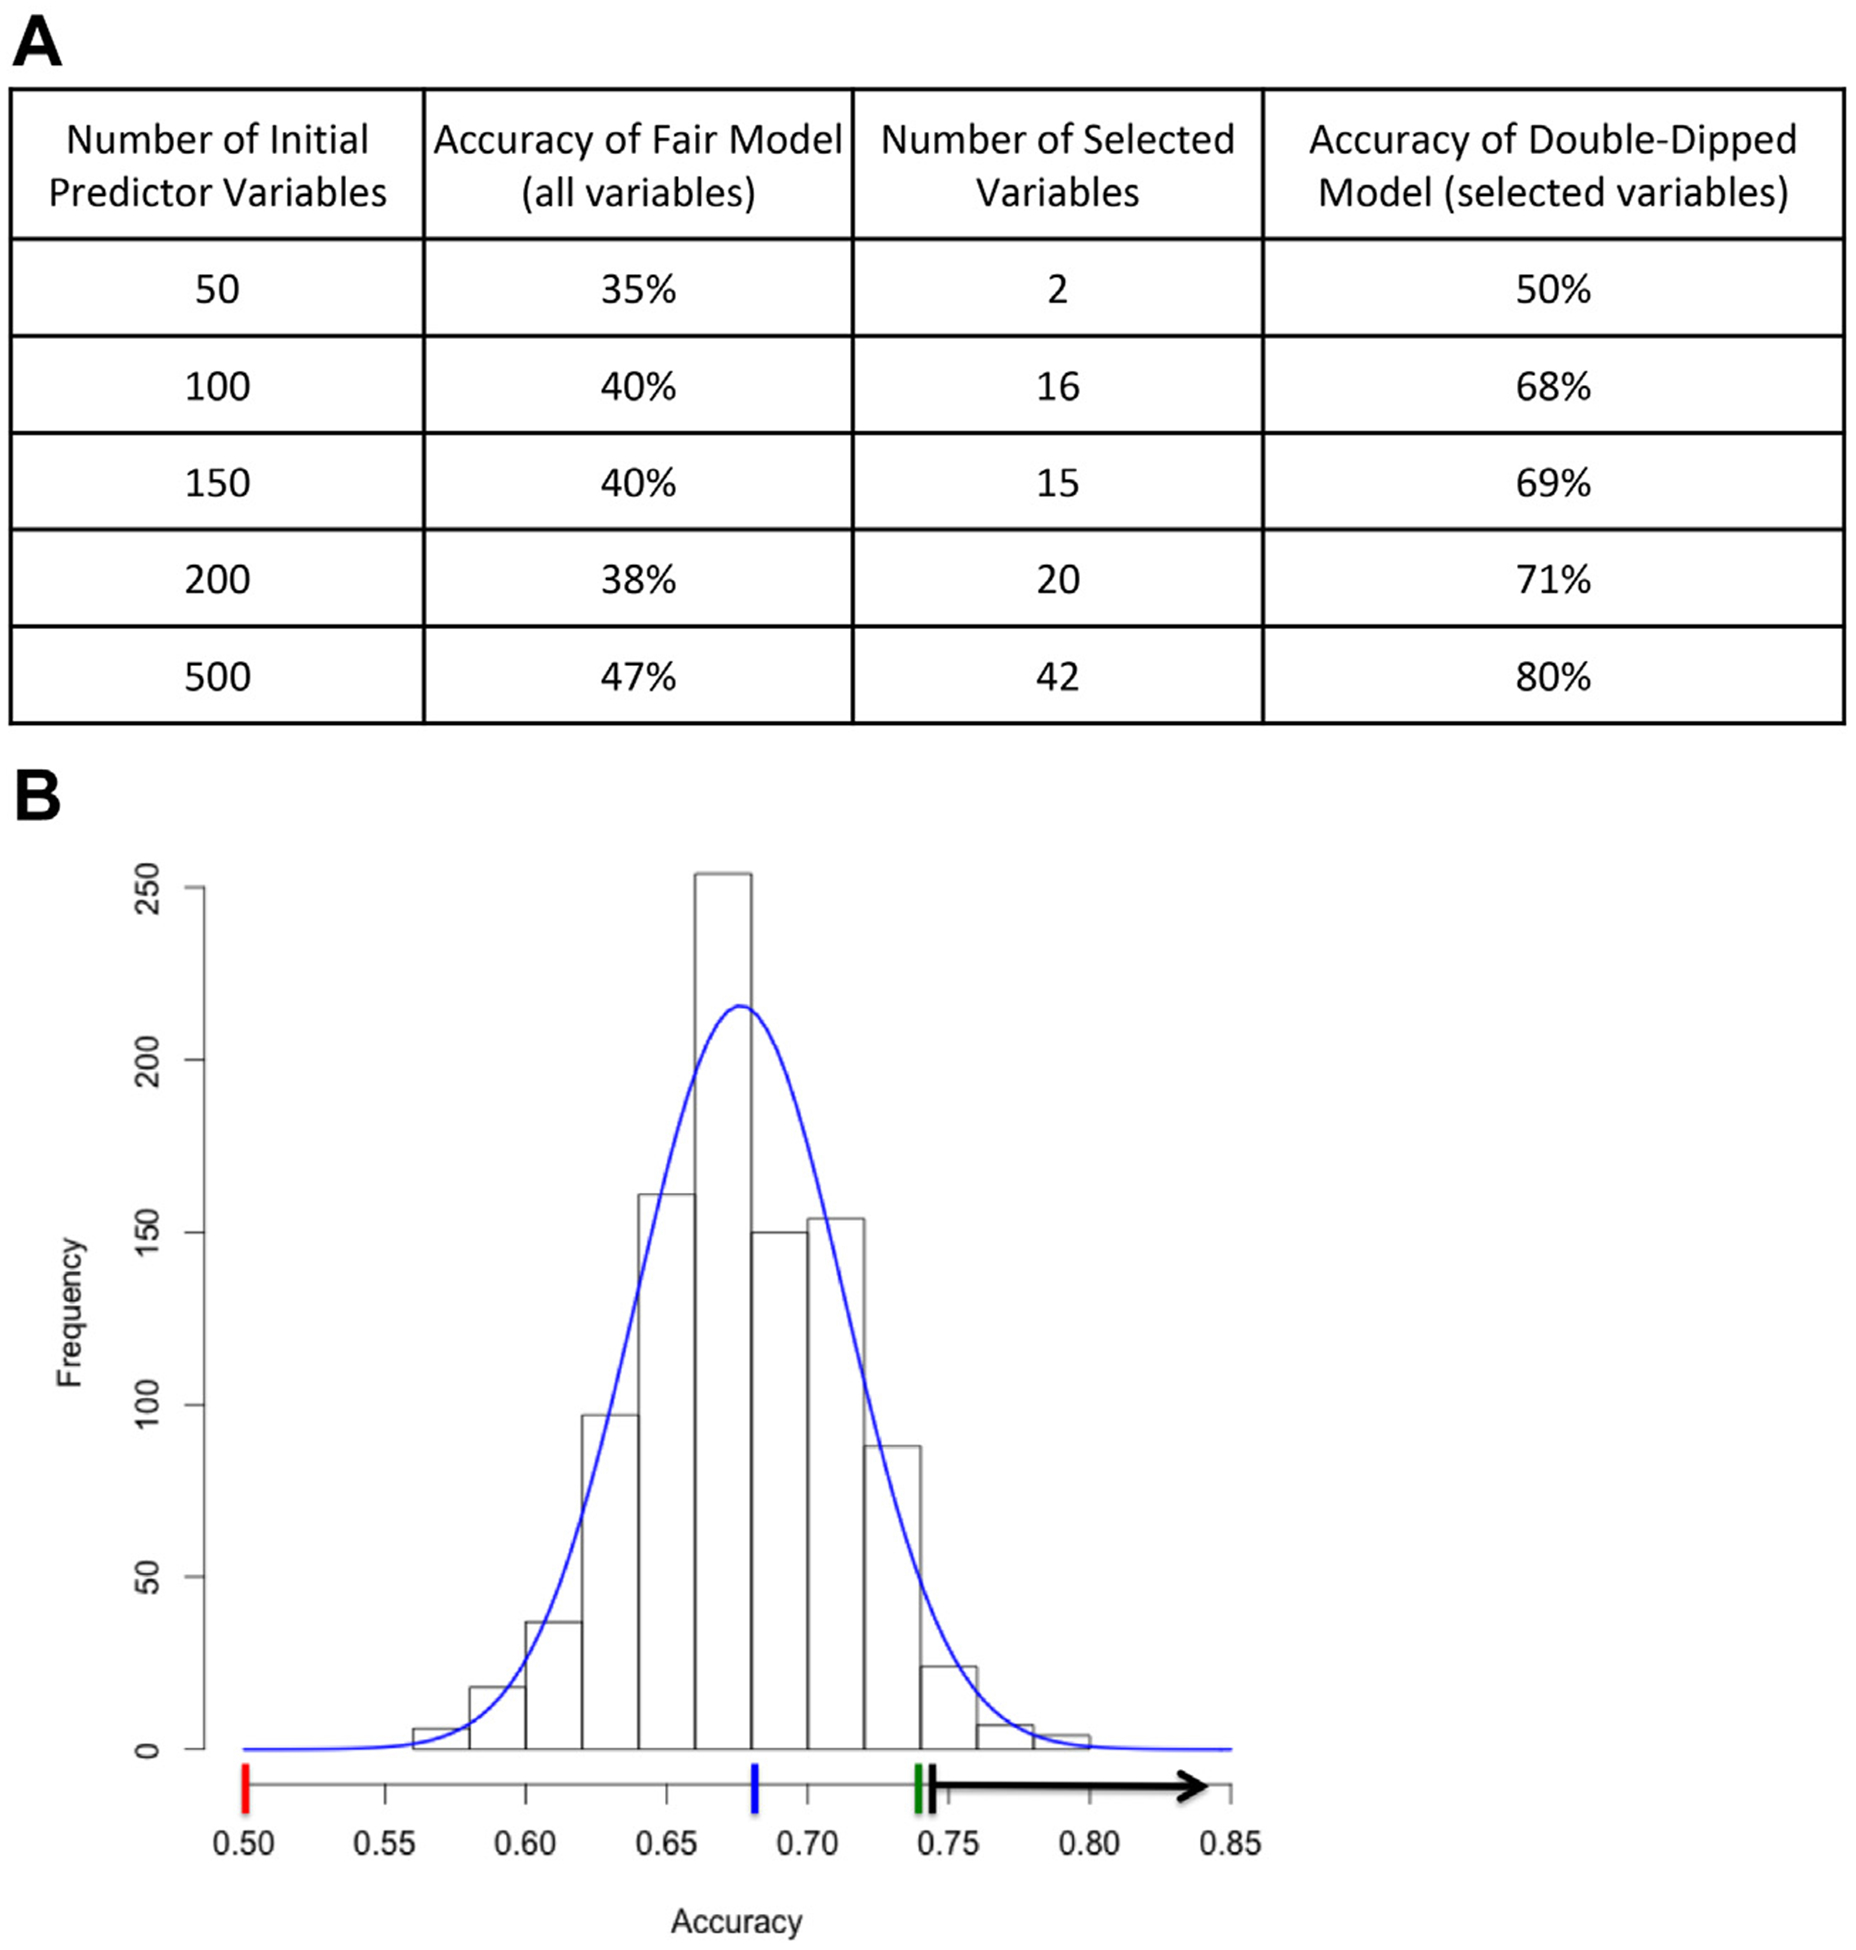
Strategies for detecting double dipping. (A) Results of random data test generated using a dataset of entirely random numbers representing a varying number of “predictor variables” (first column), and a random binary “outcome,” evenly distributed in 136 “subjects.” Because the data are random noise, model performance should be #50% and should not improve dramatically with an increasing number of random predictors, as in the fair model with all variables (second column). However, with a 2-step random forest procedure that includes double dipping to select a subset of variables (third column), the model based on fully random data shows high accuracy, especially with a large number of predictors (final column). (B) Results of a permutation test on a random forest analysis procedure that included double dipping. The red line indicates expected average accuracy of permuted outcome data if no double dipping were present (outcome base rate). The blue line indicates average accuracy of permuted data using double-dipped analysis procedure. The green line indicates observed accuracy in double-dipped analysis with real data. The black line indicates range of accuracy with 2-tailed p < .05.