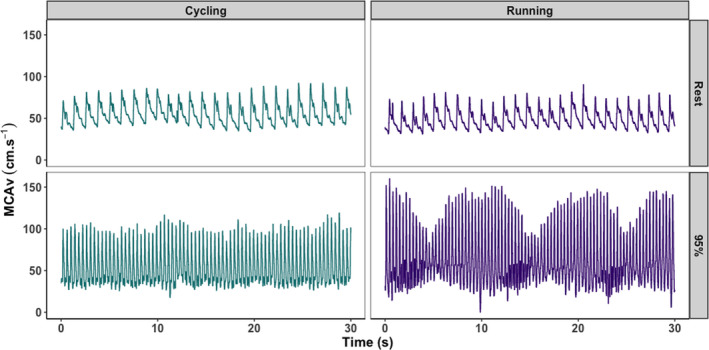
FIGURE 1.

Representative beat‐to‐beat middle cerebral artery velocity (MCAv) profiles associated with cycling (left) and running (right), both at rest (top) and during exercise at 95% of VO2max. These data illustrate the stable beat‐to‐beat MCAv profile during cycling, compared to the oscillating profile seen in running. Data presented are taken from a single participant, across the full duration of the 30‐s averaging window
