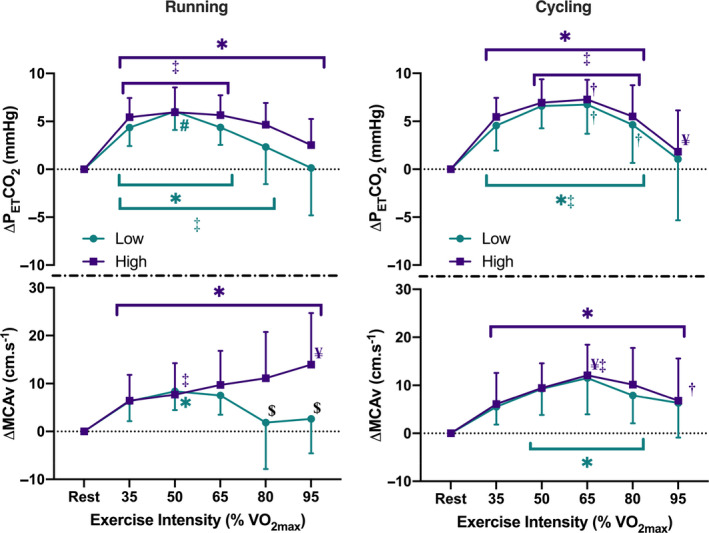
FIGURE 3.

Comparison of change in partial pressure of end‐tidal carbon dioxide (PETCO2) (top panels) and change in middle cerebral artery velocity (MCAv) from rest (bottom panels) during incremental running (left) and cycling (right) exercise (3‐min stages at 35%, 50%, 65%, 80%, 95% VO2max), between participants characterized as high (male: >45 mL/min/kg; female: >40 mL/min/kg) or low fitness (male: <40 mL/min/kg; female: <35 mL/min/kg). *Significantly different from resting values (p < .05); ¥Significantly different from 35% VO2max values (p < .05); #Significantly different from 80% VO2max values (p < .05); ‡Significantly different from 95% VO2max values (p < .05); $Low fitness significantly different from high fitness (p < .05); †Significantly different between modalities (p < .05)
