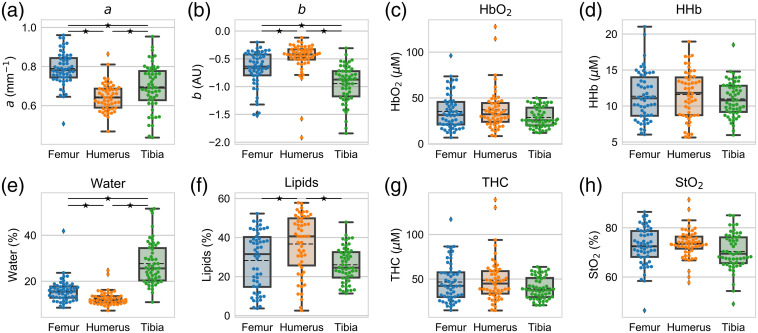
Fig. 3.
DOSI-derived metrics (a) parameter, (b) parameter, (c) , (d) HHb, (e) water, (f) lipids, (g) THC, and (h) for the humerus (orange), femur (blue), and tibia (green). Each point is the average of the left and right measurements for an individual. The box plot shows the mean (dashed black line), median (solid black line), interquartile range (box), and whiskers extending to 1.5 times the quartiles (thin black line). represents a statistical significance between bony locations at .

