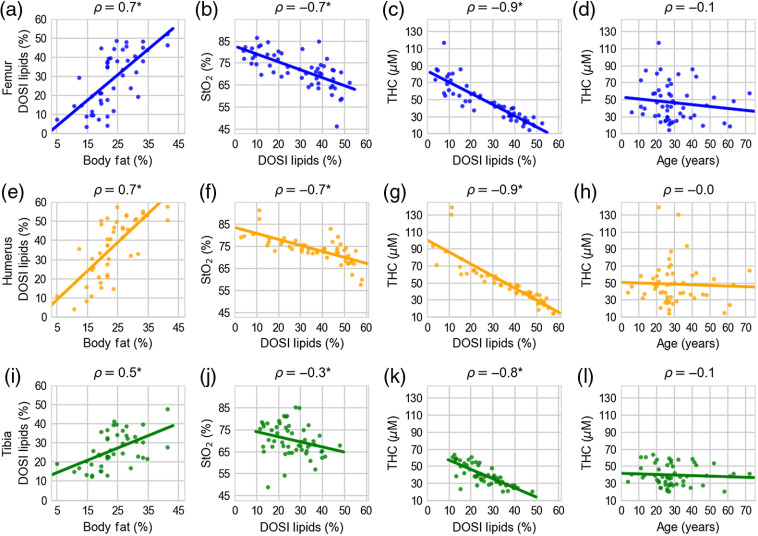
Fig. 4.
(a), (e), (i) Correlations between adult DOSI lipids and body fat percentage; (b), (f), (j) tissue oxygen saturation and DOSI lipid measurements; (c), (g), (k) THC and DOSI lipid measurements; and (d), (h), (l) THC and age for the femur (blue), humerus (orange), and tibia (green). Each point is the measurement for an individual and the line is the best fit from a linear regression. represents statistical significance at a significance level of

