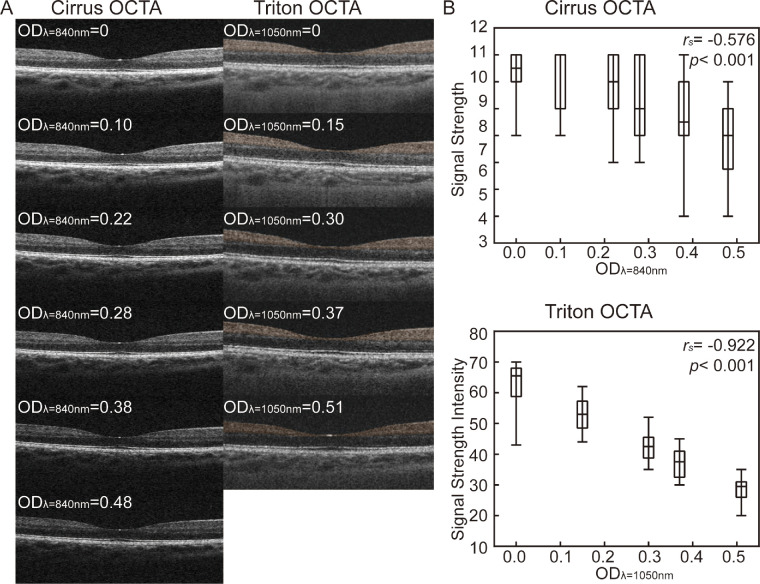
Figure 1.
B-scan and signal strength (signal strength intensity) illustrating the effect of neutral density filters on macular OCTA image acquisition. (A) B-scan of OCTA in different OD. (B) Box plot of the difference and correlation between OD and signal strength (signal strength intensity). Upper and lower whiskers show the maximum and minimum difference. The rs and P value are shown (n = 22). OD, optical density; rs, Spearman correlation coefficient.

