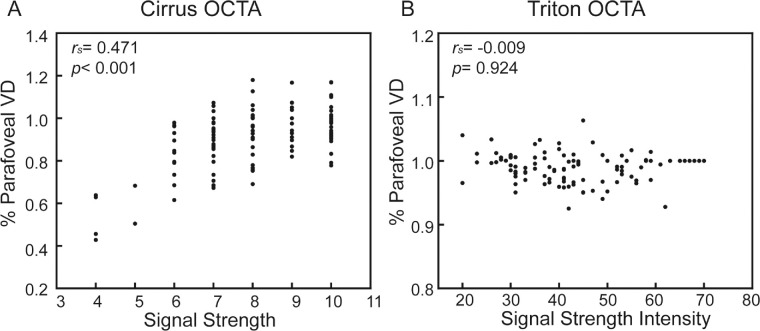
Figure 3.
Scatter plots between signal strength (signal strength intensity) and parafoveal VD of OCTA image. (A) Scatter plots and correlation between signal strength and parafoveal VD of Cirrus OCTA image. (B) Scatter plots and correlation between signal strength intensity and parafoveal VD of Triton OCTA image. Each point from one scan. The rs and P values were shown (n = 22). VD, vessel density; rs, Spearman correlation coefficient.

