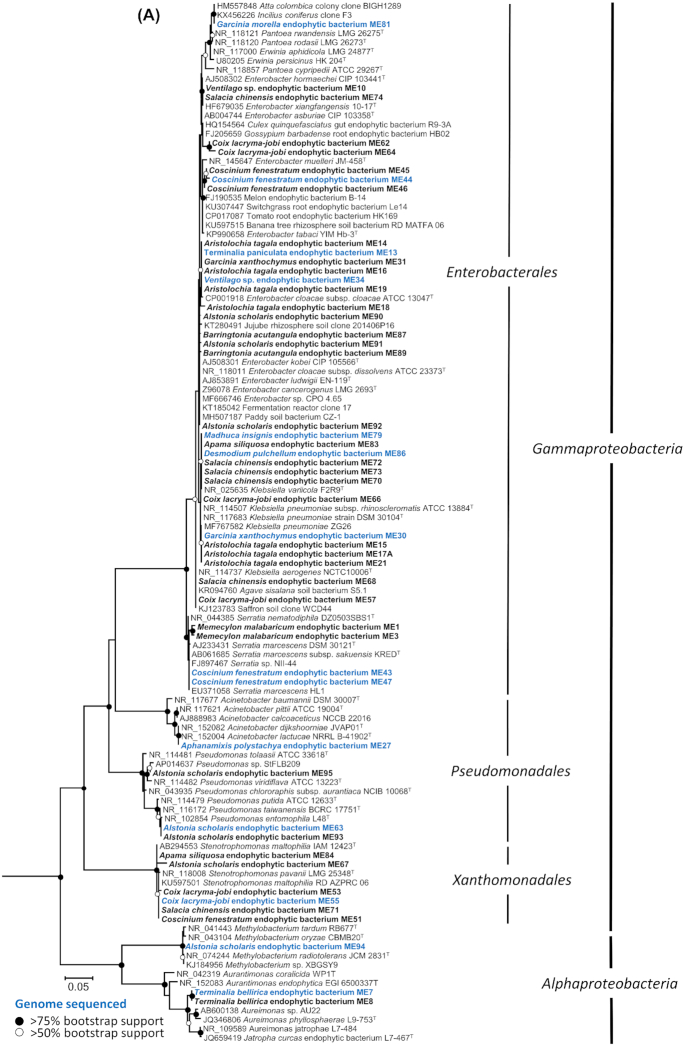
Figure 2.
Phylogenetic trees showing the relationship of medicinal plant endophyte (ME) 16S rRNA gene sequences to sequences from representative type species and other plant endophytes. (A)Proteobacteria (Gram-negative) and (B)Firmicutes and Actinobacteria (Gram-positive). Trees were constructed using Maximum Likelihood method based on the GTR model. A discrete Gamma distribution was used to model evolutionary rate differences among sites. All positions containing gaps and missing data were eliminated and there was a total of 627 and 695 positions in the final datasets, respectively. Deltaproteobacteria 16S rRNA gene sequences were used as outgroups in (A) Desulfobacter curvatus DSM 3379 (AF418175), Desulfuromonas acetoxidans DSM 684 (AAEW02000008), Desulfovibrio aerotolerans Dv06 (AY746987); and Proteobacteria 16S rRNA gene sequences were used as outgroups in (B) Methylobacterium radiotolerans JSCM 2831 ( NR_074244), Desulfovibrio aerotolerans Dv06 (AY746987), Enterobacter ludwigii EN-119T (AJ853891). Evolutionary analyses were conducted in MEGA7. The percentage of trees in which the associated taxa clustered together is shown next to the branches, based on 100 bootstraps. Nodes with black circles represent >75% bootstrap support; nodes with white circles represent >50% bootstrap support. The scale bar represents 5% sequence divergence. Sequences in bold represent ME isolates and sequences in bold blue represent ME isolates that had their genomes sequenced.

