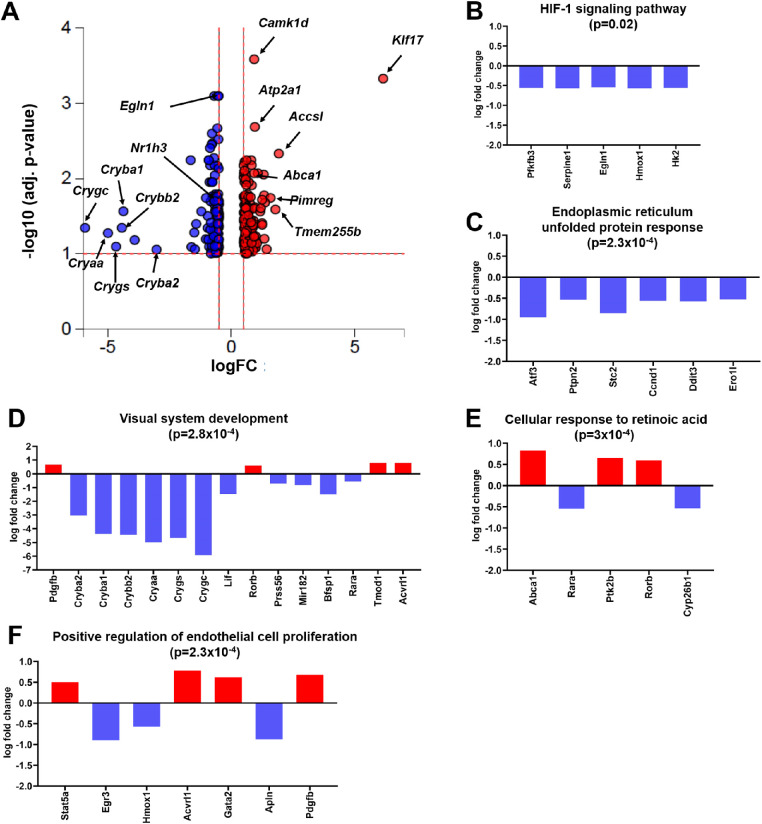
Figure 5.
MSC treatment significantly influences gene expression in the retina and optic nerve of EAE mice. (A) In the volcano plot, all 259 significantly differentially expressed (DE) genes are represented in terms of their measured expression change (x-axis) and the significance of the change (y-axis). The significance is represented in terms of the negative log (base 10) of the P value. The dotted lines represent the thresholds used to select the differentially expressed genes: 0.5 for expression change and 0.1 for significance. The bar plots show the measured gene expression of processes that are found to be significantly differently (P value in headlines) regulated in MSC-treated EAE mice. The top five processes are related to (B) HIF-1 signaling, (C) endoplasmic reticulum unfolded protein response, (D) visual system development, (E) cellular response to retinoic acid, and (F) positive regulation of endothelial cell proliferation. The upregulated genes (positive log fold change) are shown in red, whereas the downregulated genes are blue.

