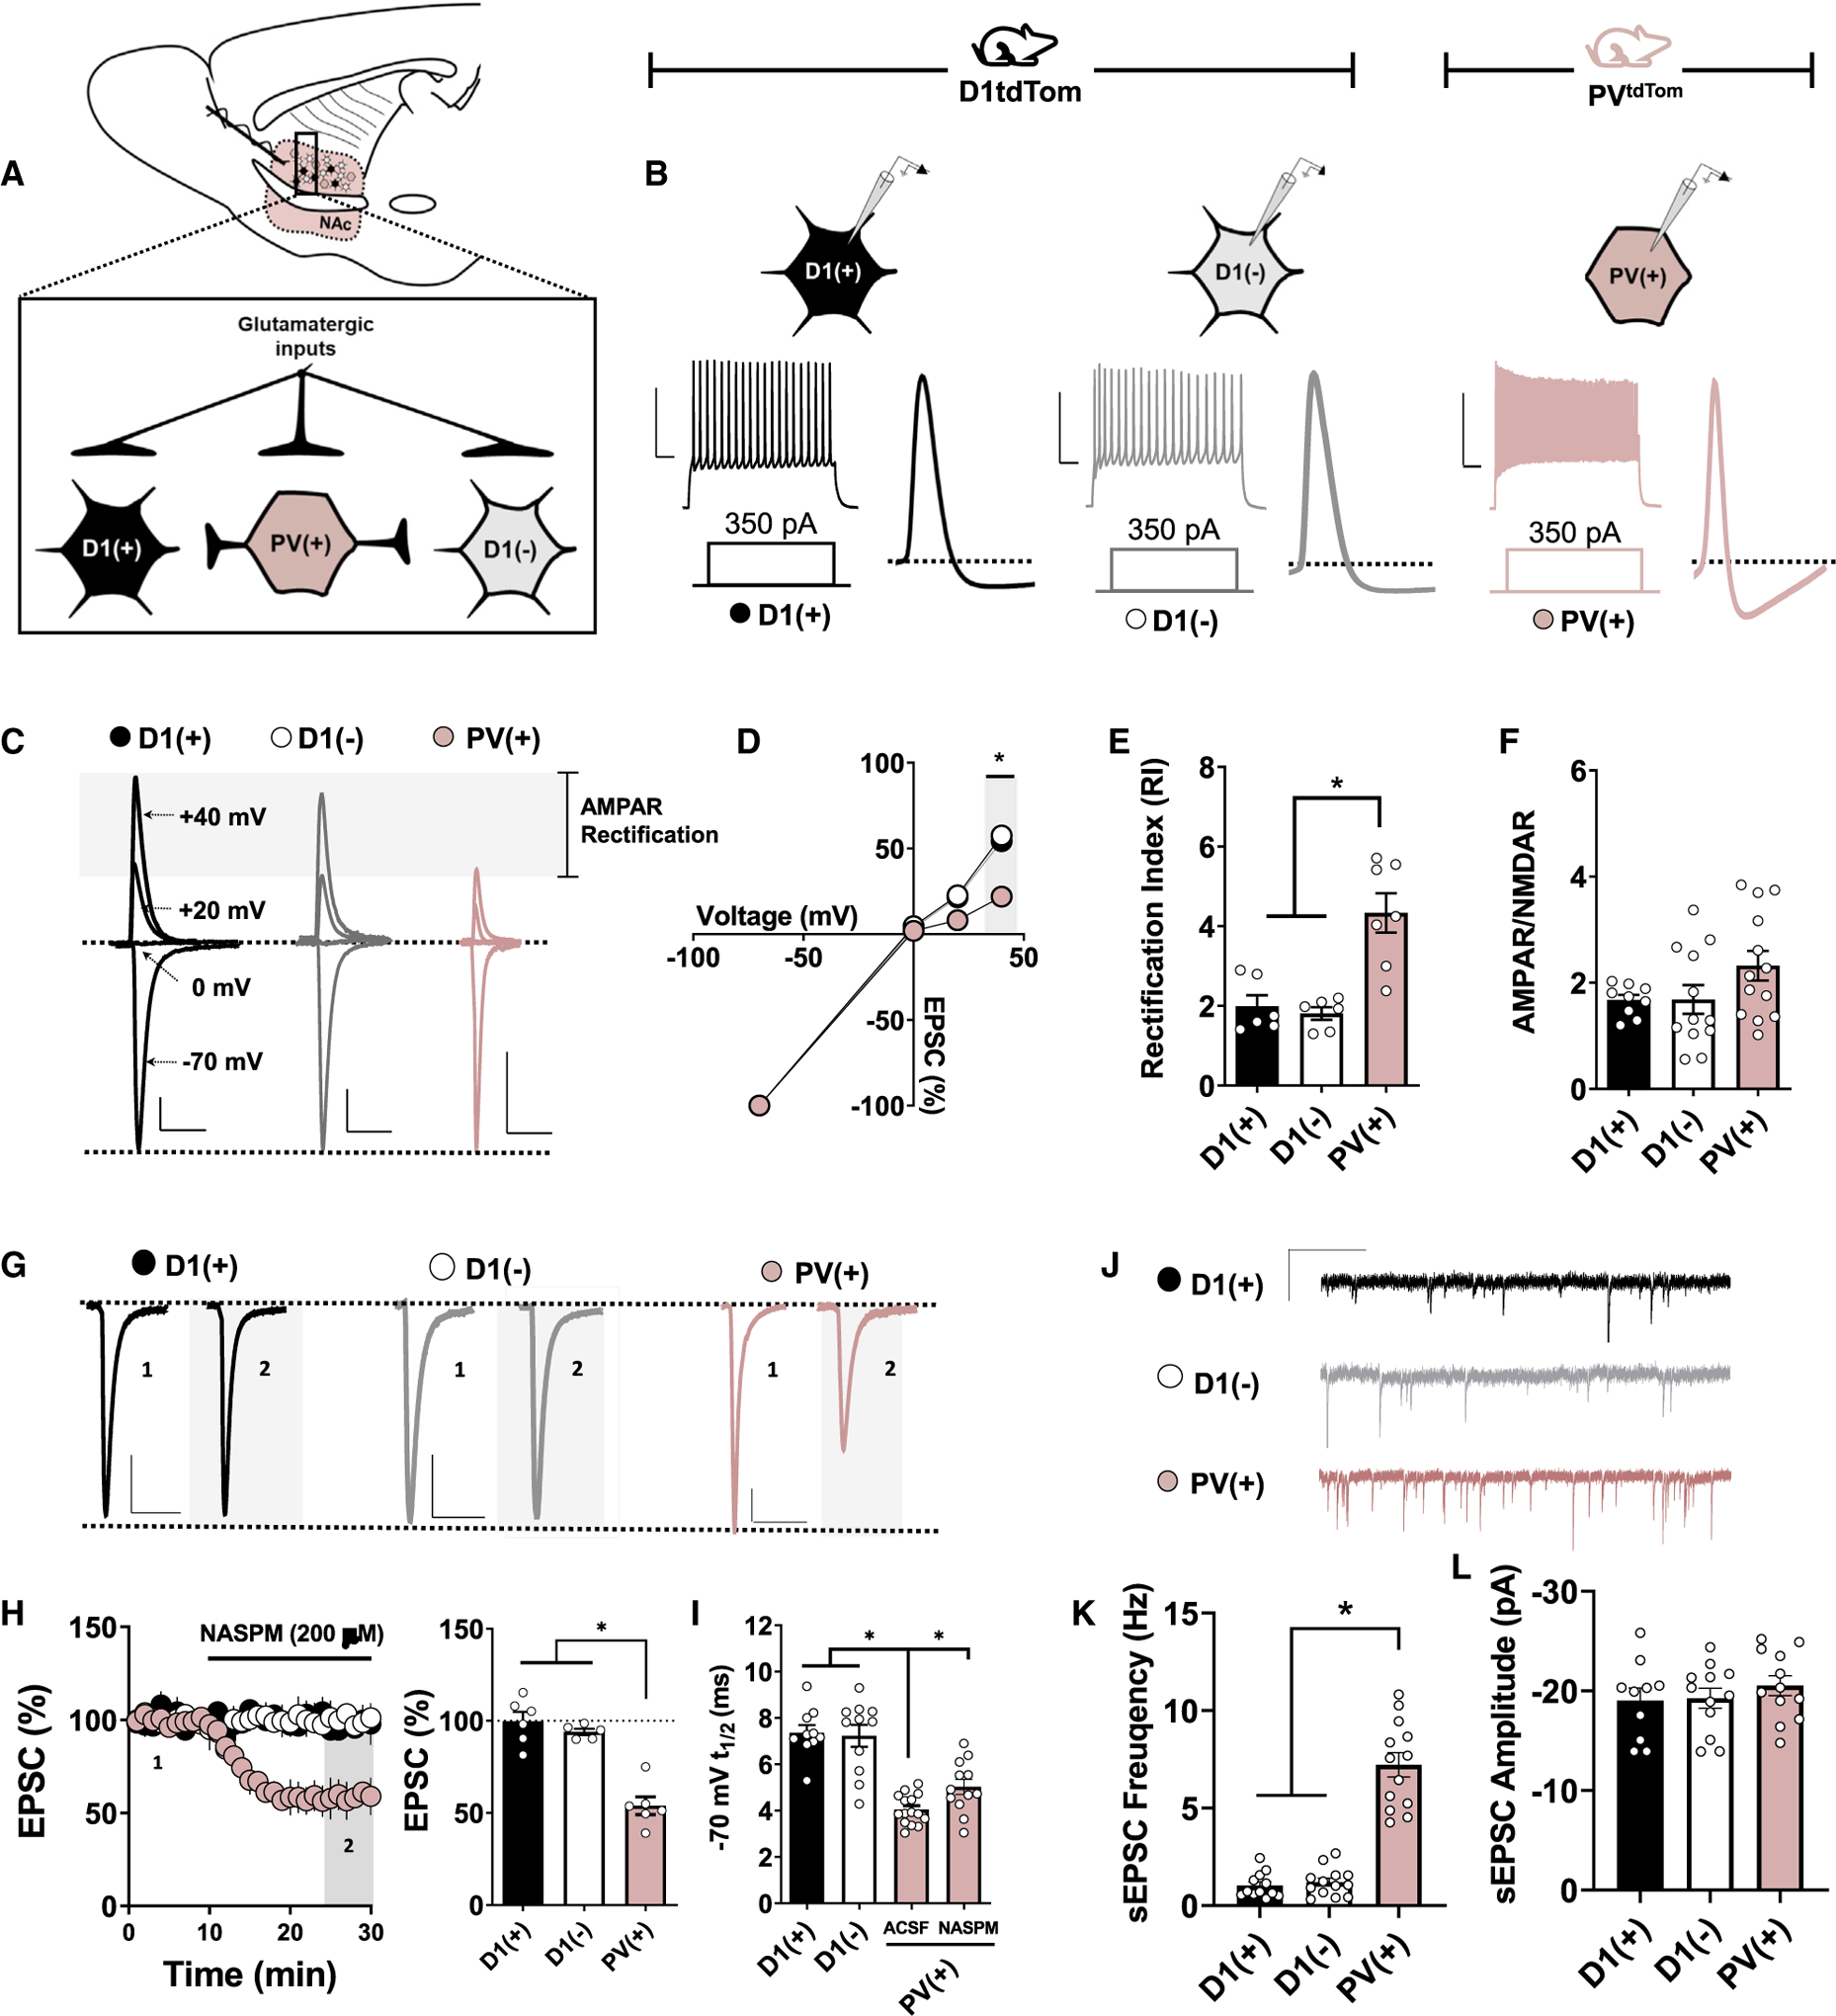
Figure 1. CP-AMPARs Are Expressed Basally at Glutamatergic Synapses onto PV(+)-INs in the NAc Core.

(A) Schematic depicting transgenic reporter strategy and electrophysiological configuration within feedforward microcircuitry. D1(+) MSNs, black-filled circles; D1(−) MSNs, open circles; PV(+)-INs, pink-filled circles.
(B) Representative traces of APs elicited in PV(+), D1(+), and D1(−) cells after a 350-pA somatic current injection. Scale bar: 50 mV/100 ms.
(C) Representative AMPAR-mediated EPSCs in PV(+), D1(+), and D1(−) cells when voltage clamped at −70, 0, +20, and +40 mV. Scale bars: 100 pA/50 ms.
(D and E) AMPAR I-V relationship (D) and RI quantified (E) in PV(+), D1(+), and D1(−) cells.
(F) Average AMPAR:NMDAR ratios obtained from PV(+), D1(+), and D1(−) cells showing no difference between cell types.
(G) Representative traces of EPSCs obtained from PV(+), D1(+), and D1(−) cells at baseline and in the presence of NASPM. Scale bars: 50 pA/50 ms.
(H) Time course summary of normalized EPSC amplitude and Quantification of average EPSC amplitude at PV(+), D1(+), and D1(−) synapses during NASPM bath application.
(I) Decay t1/2 of EPSCs at −70 mV in PV(+), D1(+), and D1(−) cells showing differences in AMPAR decay kinetics and the contribution of CP-AMPARs.
(J) Representative traces of sEPSCs in PV(+), D1(+), and D1(−) cells.
(K) Average sEPSC frequency in PV(+), D1(+), and D1(−) cells over a 5-min recording period. Scale bar: 20 pA/60 s.
(L) Average sEPSC amplitude in PV(+), D1(+), and D1(−) cells over a 5-min recording period. Error bars indicate SEM. *p < 0.05.
