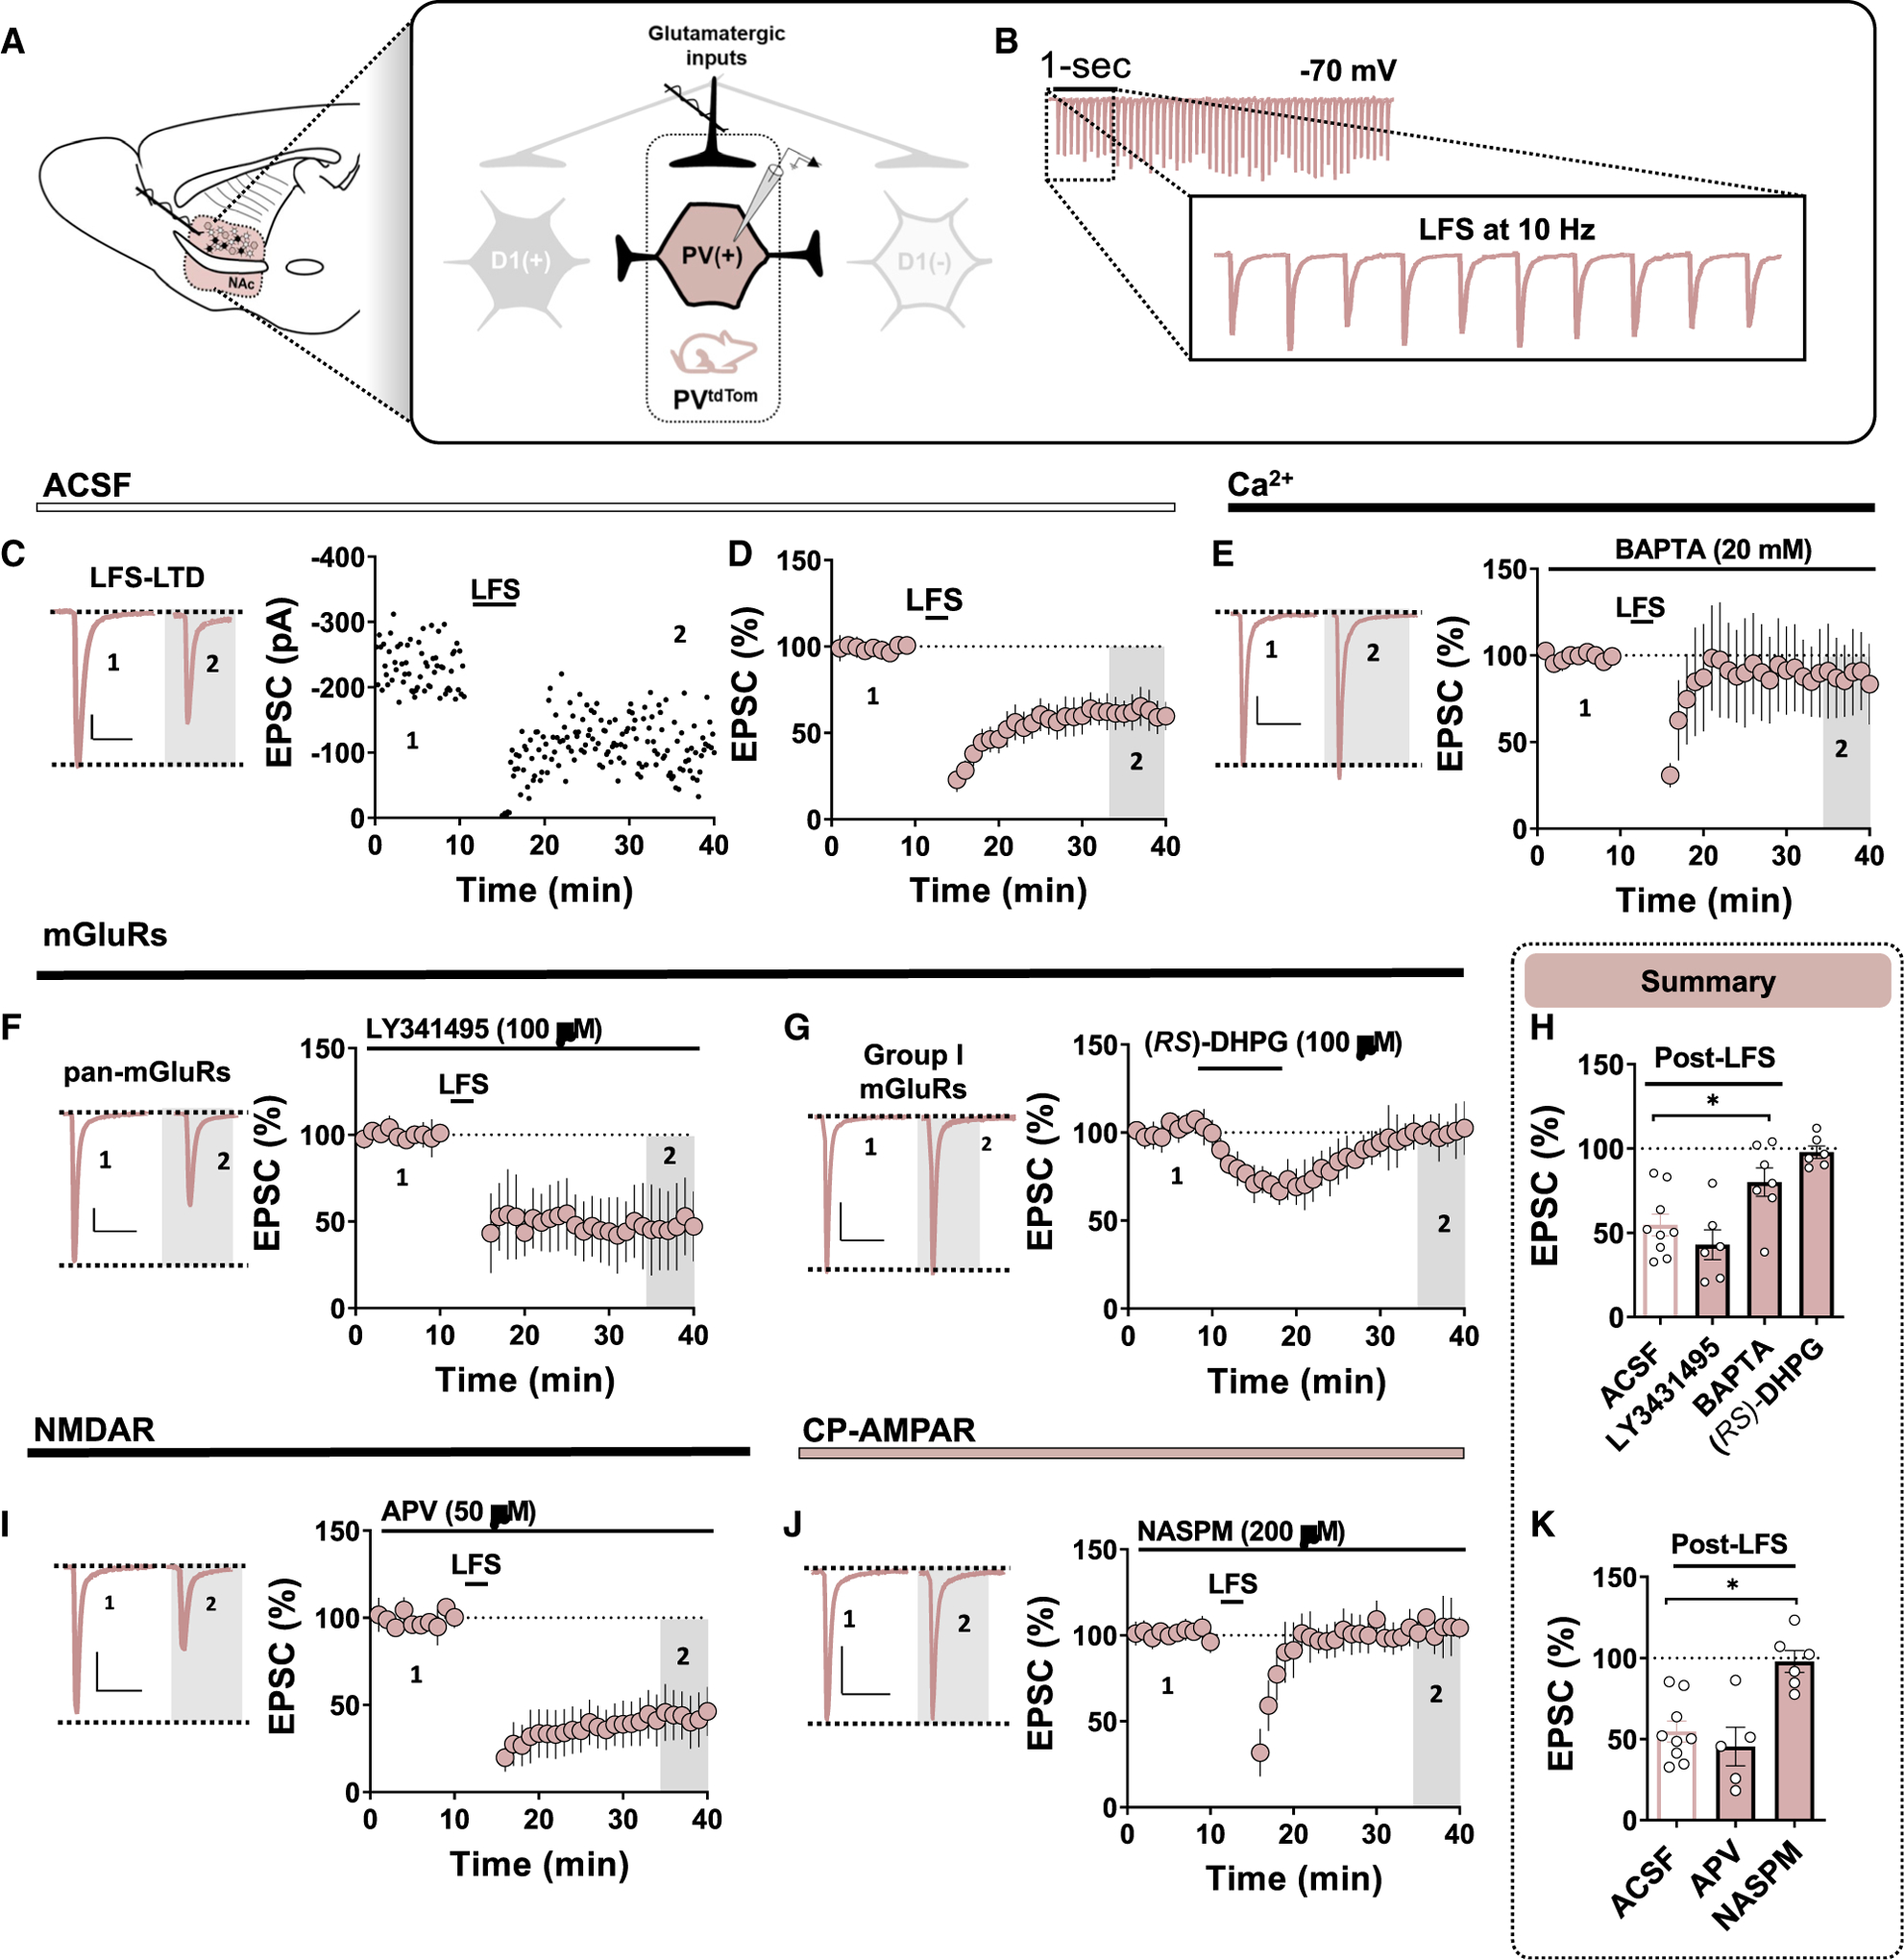
Figure 3. LFS Triggers Ca2+ and CP-AMPAR-Dependent LTD of Glutamatergic Transmission onto PV(+)-INs.

(A) Schematic depicting PVtdTom transgenic reporter strategy and electrophysiological configuration within feedforward microcircuitry. Note that all experiments were performed in the dorsomedial NAc core near the corticoaccumbens interface. Scale bar for all panels: 50 pA/50 ms.
(B) Representative traces of high-fidelity EPSCs recorded from PV(+) during the 10-Hz LFS induction protocol.
(C) Representative traces and experiment in PV(+)-INs at baseline and post-LFS showing that LFS induces robust LTD of glutamatergic transmission.
(D) Time course summary of normalized EPSCs in PV(+)-INs during LFS recording period.
(E) Representative EPSCs and normalized time-course summary of LFS-induced LTD assessed with a Ca2+ chelator, BAPTA, included in the internal solution.
(F) Representative EPSCs and normalized time course of LFS-induced LTD assessed in the presence of a pan-mGluR antagonist, LY341495.
(G) Representative EPSCs and normalized time course summary showing that group I mGluR agonist, (RS)-DHPG, fails to elicit LTD at synapses onto PV(+)-INs.
(H) Quantification of normalized EPSC amplitude post-LFS t(gray) (35–40) min in ACSF, LY341495, and BAPTA and average EPSC amplitude post-DHPG.
(I) Representative EPSCs and normalized time course summary of LFS-induced LTD assessed in the presence of an NMDAR antagonist, APV.
(J) Representative EPSCs and normalized time course of LFS-induced LTD assessed in the presence of NASPM.
(K) Quantification of normalized EPSC amplitude post-LFS t(gray) (35–40) min in APV and NASPM. ACSF average depicts the same data in (H). Error bars indicate SEM. *p < 0.05.
