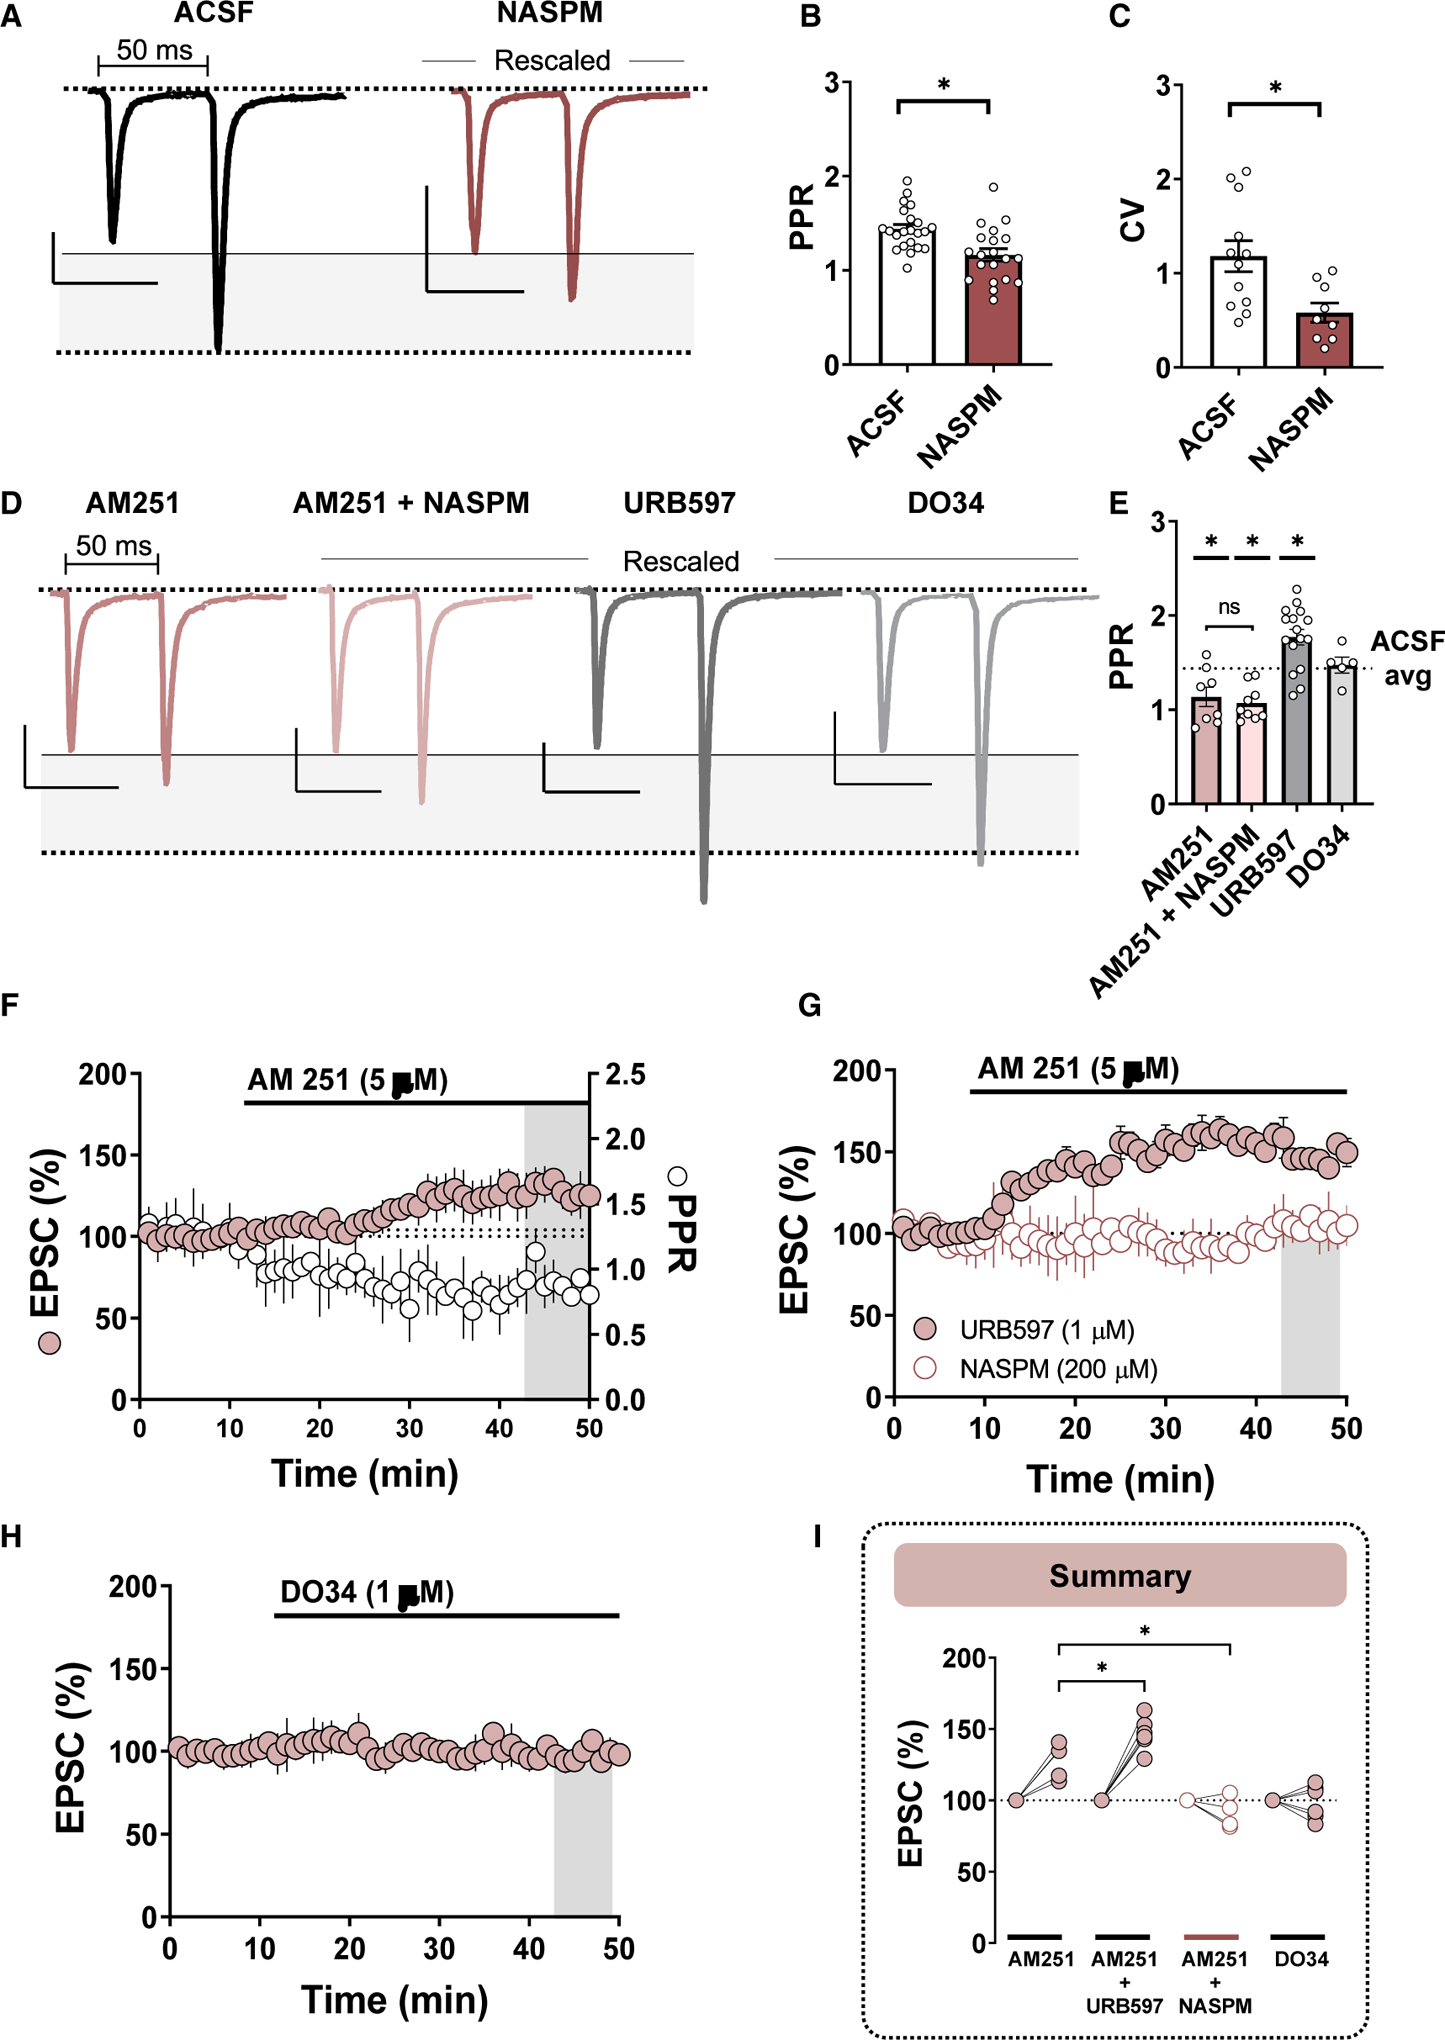
Figure 4. CP-AMPARs Gate Tonic eCB Signaling through CB1Rs at Glutamatergic Synapses onto PV(+)-INs.

Gray-shaded region highlights the amplitude difference between EPSC1 and EPSC2 of the paired pulses during 50-ms paired-pulse stimulation. All traces scaled to have comparable EPSC1 amplitudes.
(A) Representative traces of 50-ms paired-pulse EPSCs obtained from PV(+)-INs in ACSF (black)- and NASPM (maroon)-incubated slices. Scale bars: 50 pA/50 ms.
(B and C) Quantification of average PPR (B) and CV (C) obtained from PV(+)-INs in ACSF versus NASPM.
(D) Representative traces of 50-ms paired-pulse EPSCs obtained from PV(+)-INs in slices incubated in AM251 (pink), AM251 + NASPM (light pink), URB597 (gray), and DO34 (light gray). Scale bars for all traces: 50 pA/50 ms.
(E) Average PPR following each pharmacological manipulation. Dotted line corresponds to average EPSC amplitude plotted for visual and statistical purposes.
(F) Left y axis: normalized time course summary of average EPSC amplitude in PV(+)-INs during bath application of AM251. Right y axis: raw PPR time course during AM251 superfusion (open circles).
(G) Normalized time course summary of average EPSC amplitude during AM251 bath application in slices incubated and continuously perfused with URB597 (pink-filled circles) or NASPM (open circles).
(H) Normalized time course summary of EPSC amplitude during acute bath application of DO34.
(I) Quantification of average EPSC amplitude following each pharmacological manipulation. Error bars indicate SEM. *p < 0.05.
