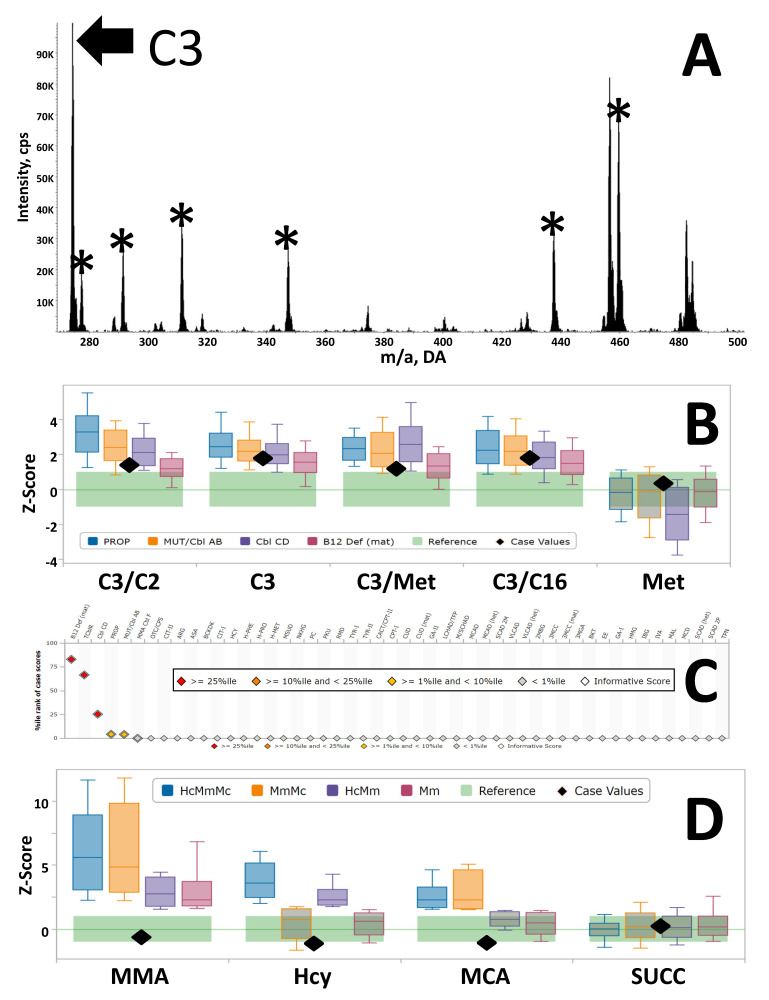
Figure 2.
Panel (A) Acylcarnitine profile of a case with elevated C3 as first tier result, p85 profile of butyl-ester species. *, Internal standards [18]. Panel (B) Acylcarnitine profile of a case with elevated C3 as first tier result, p85 profile of butyl-ester species. *, Internal standards [18]. Panel (C) CLIR post-analytical tool “All Conditions Tool”. Color coding of scores is according to the embedded legend. Y-axis is the %ile rank of case scores (likelihood of disease), conditions are sorted highest to lowest from the left. Panel (D) CLIR productivity tool “Plot by Multiple Conditions” for the four markers measured by the second tier test (2TT). Black diamonds arranged as in Panel B. Concentrations were as follows: MMA 0.3 nmol/mL (test catalog reporting cutoff <5); tHcy 0.9 nmol/mL (<15); MCA 0.1 nmol/mL (<1). Abbreviations of conditions are as follows: Hc, isolated elevation of tHcy; HcMmMc, combined elevated concentrations of tHcy, MMA, and MCA; MmMc, combined elevated concentrations of MMA and MCA; HcMm, combined elevated concentrations of tHcy and MMA; Mc, isolated elevation of MCA; Mm, isolated elevation of MMA. Ranges are shown as Multiple of the Median after simultaneous adjustment for age (hours), birth weight (grams), and location.

