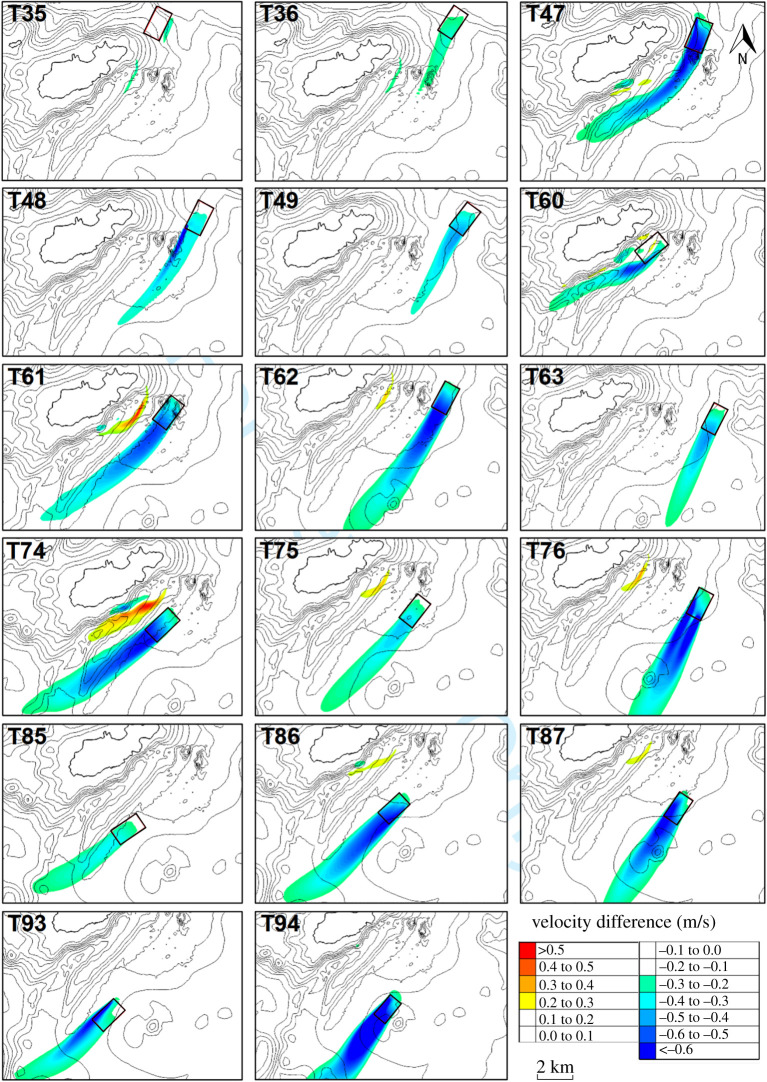
Figure 9.
Flow speed differences for 17 energy extraction scenarios (indicated in figure 7a). Identical colour scales are used to aid inter-scenario comparison. Outputs are all for the same equivalent model time step and relate to the ebb spring tide (the largest tidal cycle of the model run). Array footprints are highlighted by bold inclined rectangles. Velocity differences <±0.2 m s−1 are not shaded. (Online version in colour.)

