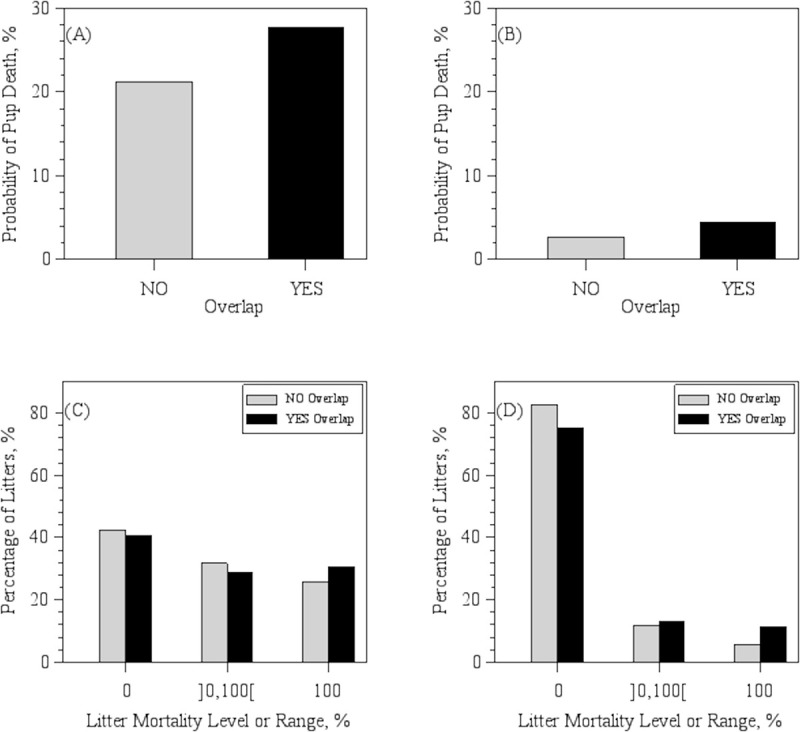
Fig 1. Probability of pup death and litter mortality distribution.

Probability of pup death in litters without (NO) or with (YES) the presence of older siblings in the cage (litter Overlap) at (A) C1, the Babraham Institute, and (B) C2, the Wellcome Sanger Institute, based on least-square means. Percentage of litters by category of pre-weaning mortality in Overlapped and Non-Overlapped litters at (C) C1 and (D) C2, based on raw data. Numbers within brackets in the x-axis designate lower (left side) and upper (right side) endpoints of mortality range. An open bracket next to a number designates a non-inclusive endpoint.
