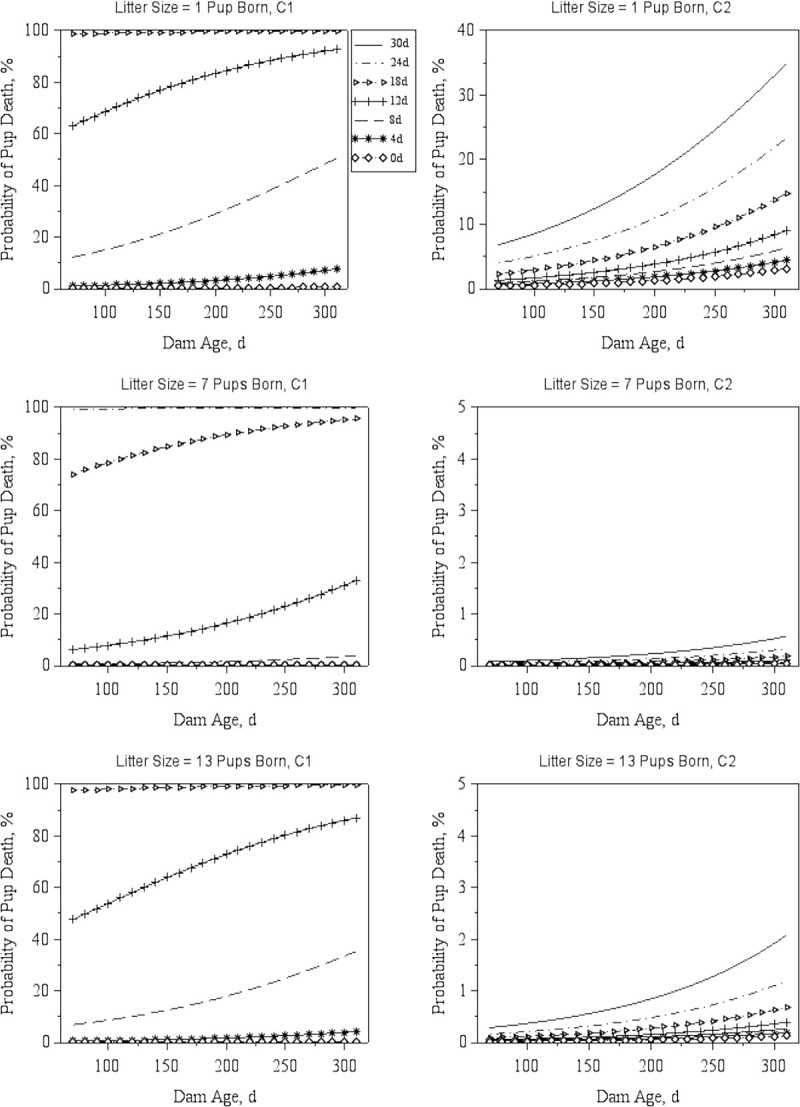
Fig 2. Probability of pup death by Dam Age and Sibling Age.

Predicted probabilities (least-squares means) of a pup to die as a function of Dam Age for three distinct levels of Litter Size (number of pups born), at C1, the Babraham Institute and C2, the Wellcome Sanger Institute. Each line corresponds to predictions for a specific value of Sibling Age, as depicted in the legend next to the top left graph. Predictions were obtained while assuming six older pups in the cage, the most recurrent Weekday (Thursday) and the most common Season (Spring) in the combined dataset.
