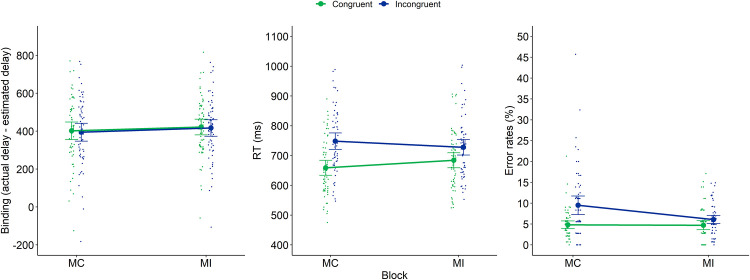
Fig 2. Intentional binding (left panel), RTs (middle panel) and error rates (right panel) of Experiment 1 as a function of previous congruency and current congruency.
Dots represent mean RTs for each participant in each condition (thus, each participant is depicted four times on this graph, once for each Previous × Current Congruency condition). Error bars represent 95% confidence intervals.

