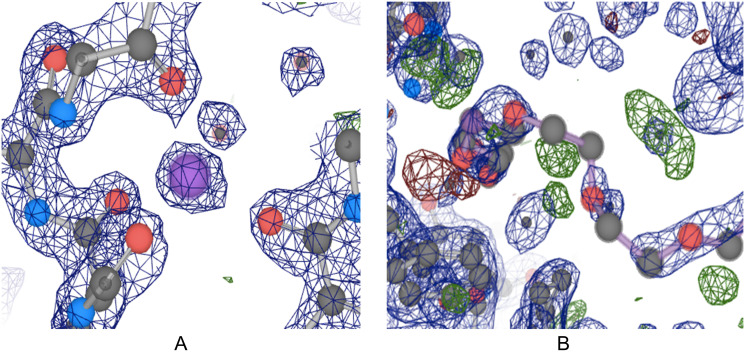
Fig 1. Model and difference electron density maps.
Both panels A and B are from the same structure, PDB ID: 3B1Q, and are centered around the ligands B.330 (A) and P.33 (B). Blue meshes represent the model electron density. Green and red meshes represent discrepancies between experimental data and the structure model. The structure has very good overall quality, as demonstrated by a resolution of 1.7 Å, an R-factor value of 0.176, and an R-free value of 0.207. The panel A shows a high-quality region in the structure where the experimental data and model match very well. And the panel B shows that there are still low-quality regions within the structure, as demonstrated by the green and red blobs around the coordinating ligand residue (“ligand” refers to the coordination chemistry definition of this word).

