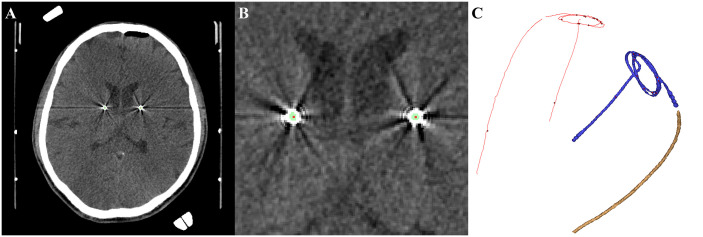
Fig 2. Process of 3-dimensional reconstruction and centerline rendering.
A. A postoperative brain computed tomography scan was used in the calculation. B. Green indicates intracranial leads, which were defined as an area of Hounsfield units exceeding 2700, and red indicates the centerline rendered with software logic. C. Reconstructed intracranial lead (right side, volume rendered) and rendered centerline (left side, red).

