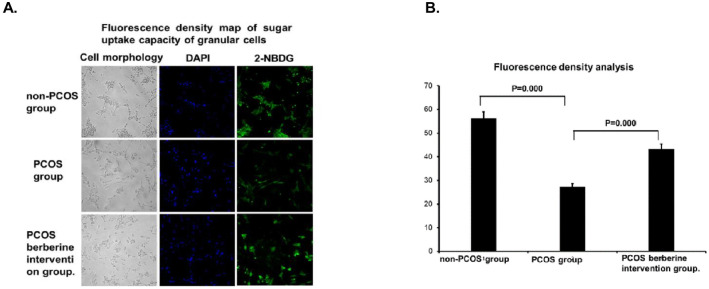
Fig 2.
(A Fluorescence density map of sugar uptake capacity of granular cells. (B Fluorescence density analysis. Granulosa cells of both non-PCOS and PCOS patients were obtained in vitro for in vitro culture. PCOS granule cells were randomly divided into two groups: one group was cultured normally, and the other group was added with berberine with final concentration of 100μM. After 24h, the serum-free culture solution containing 2-nbdg with a final concentration of 50μM and insulin of 100nM was replaced at 37°C. After 1h incubation, the difference in green fluorescence intensity of 530nm was compared under fluorescence microscope, and the difference in fluorescence density between different groups was compared by using flowjo-v10. Data were represented by mean±standard deviation (SD), and SPSS 20.0 statistical software was used for analysis. P-value less than 0.05 was considered statistically significant.

