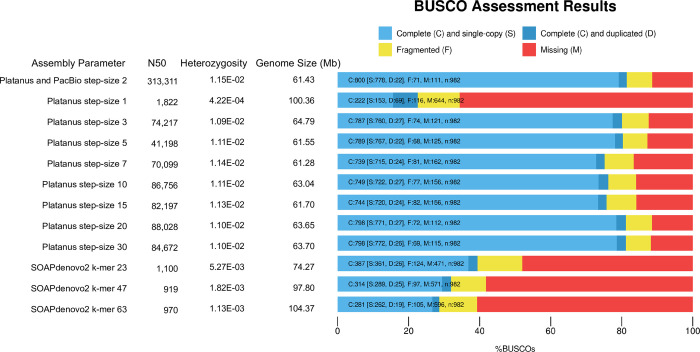
Fig 1. Assessment of genome completeness. Assembly and parameters are reported in the first column followed by N50 (nt), heterozygosity (as defined in Methods), genome size (Mb), and the BUSCO results.
The proportion complete and single copy is represented in light blue, complete and duplicated is represented in dark blue, fragmented is represented in yellow, and missing is represented by red.

