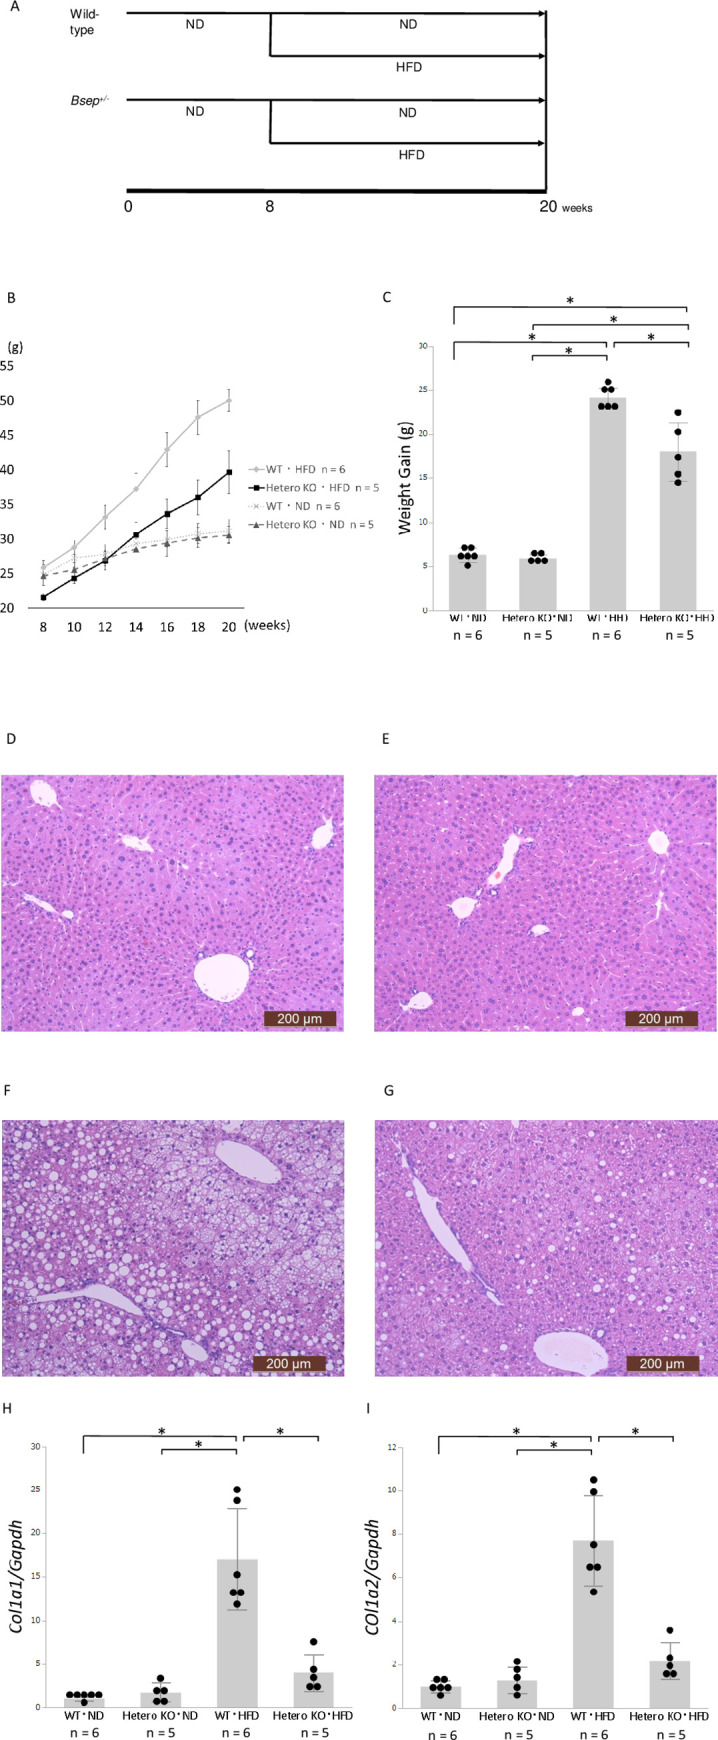
Fig 1. Bsep+/- and Wild-Type (WT) mice fed with a Normal Diet (ND) or High-Fat Diet (HFD).

A: Time course. WT mice fed an ND (n = 6) or HFD (n = 6). Bsep+/- mice fed an ND (n = 5) or HFD (n = 5). B and C: Transition of body weight (B) and weight gain (C). Values are expressed as means ± standard deviations (n = 5 or 6). * p < 0.05. D, E, F, and G: Hematoxylin & eosin staining of representative liver specimens. D: ND-fed WT mice. E: ND-fed Bsep+/- mice. F: HFD-fed WT mice. G: HFD-fed Bsep+/- mice. Bars: 200 μm (D, E, F, and G). H and I: Hepatic expression levels of Col1a1 and Col1a2. Values are expressed as means ± standard deviations (n = 5 or 6). * p < 0.05.
