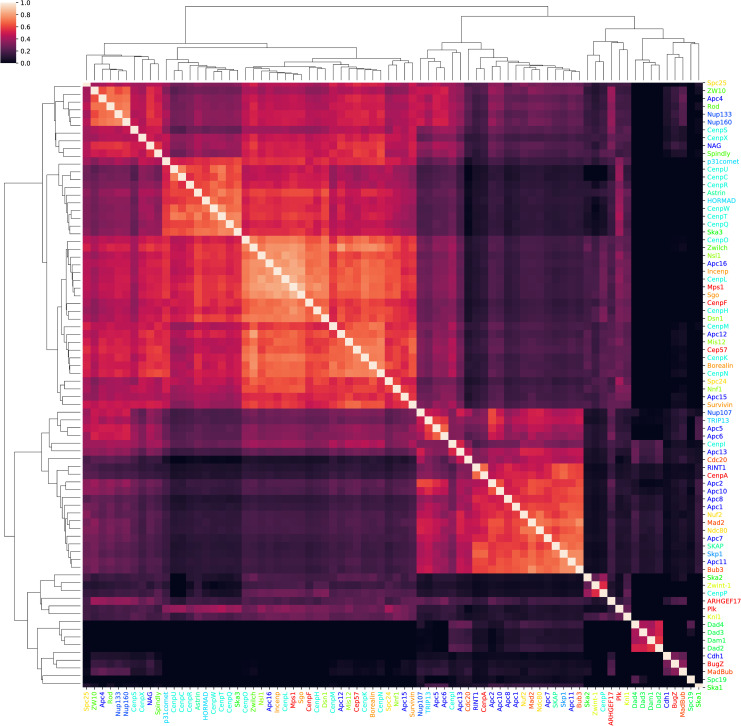
Fig 3. Recovery of kinetochore and APC complexes.
After mapping each of the protein families presented in Van Hooff et al. [10] to their corresponding HOG, a distance matrix was constructed by comparing the Jaccard hash distance between profiles using HogProf. Name colors in the rows and columns of the matrix correspond to the kinetochore and APC subcomplex components as defined manually using literature sources [10].

