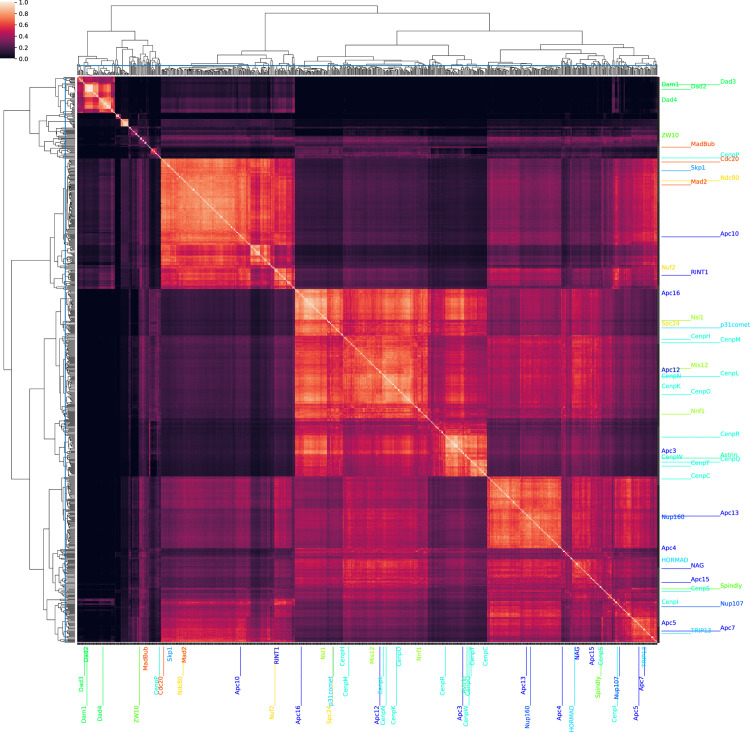
Fig 4. Putative novel components of the kinetochore and APC complexes.
The profiles associated with all HOGs mapping to known kinetochore components shown in Fig 3 were used to search the LSH Forest and retrieve the top 10 closest coevolving HOGs resulting in a list of 871 HOGs including the queries from the original complexes. The Jaccard distance matrix is shown between the hash signatures of all query and result HOGs. UPGMA clustering was applied to the distance matrix rows and columns. Labelled rows and columns correspond to profiles from the starting kinetochore dataset [10]. A cutoff hierarchical clustering distance of 1.3 was manually chosen (blue lines) to limit the maximum cluster size to less than 50 HOGs. This cutoff resulted in a total of 142 clusters of HOGs used for GO enrichment to identify functional modules. The coloring of the protein family names to the right and below the matrix is identical to the complex related coloring shown in Fig 3.

