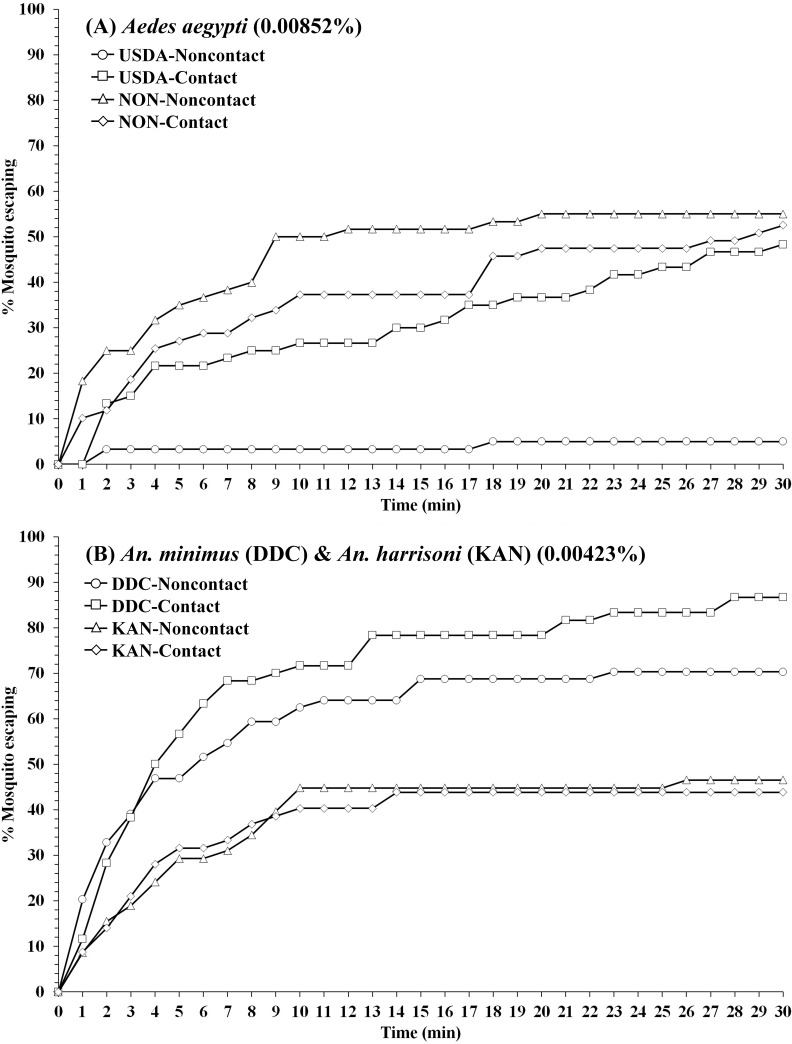
Fig 4. Comparison percentage escape patterns for (A) Ae. aegypti USDA strain and Nonthaburi (NON) field population, and (B) An. minimus DDC strain and An. harrisoni Kanchanaburi (KAN) field population in contact and noncontact ER assays.
Escape responses recorded at 1-min intervals during 30-min exposure to TFT at LC50 established for each laboratory strain [40]. Concentration for An. minimus applied for An. harrisoni. Paired control escape responses not shown.

