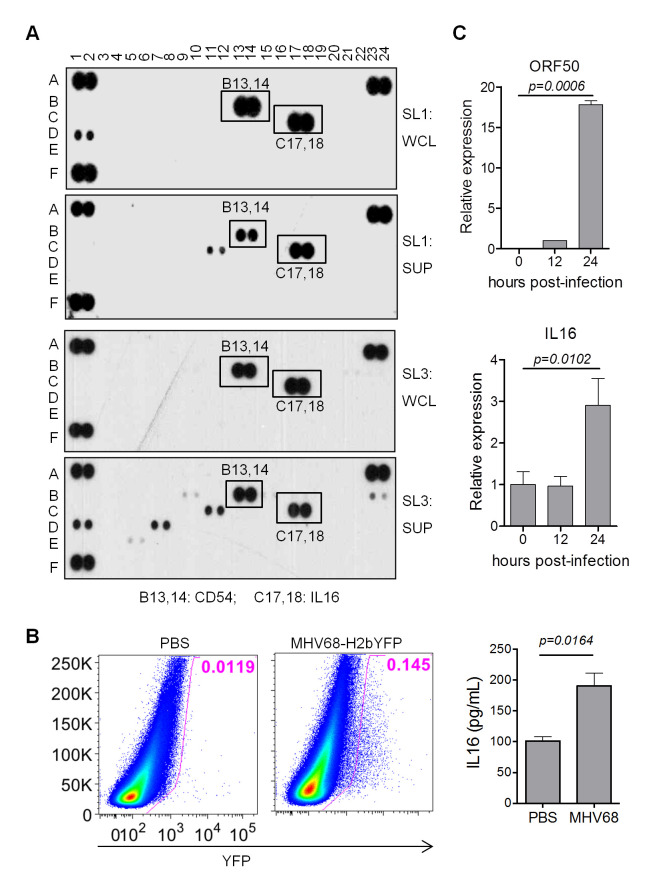
Fig 1. MHV68 infection increases IL16 expression.
(A) 1×10⁶ SL-1 and SL-3 cells were cultured for 24 hr, whole-cell lysate (WCL) and supernatant (SUP) were prepared and subjected to cytokine array analyses. Each cytokine has one pair of duplicate spots. A1-2, A23-24, and F1-2 are experimental positive control, and F23-24 is an experimental negative control. (B) C57BL/6 mice were intranasally inoculated with 5×10⁴ PFU of MHV68-H2bYFP or mock inoculated with PBS. At day 16 post-infection, splenocytes were isolated and subjected to flow cytometry, the flow plot represented the strategy gating YFP+ MHV68 infected cells (left panel); serum was prepared from 10 virus-infected mice or mock-infected mice, followed by IL16 ELISA assay (right panel). Histograms represented mean ±SD of 10 individual mice (two experiments, n = 5 for each experiment). p value was determined by two-tailed unpaired t-test. (C) WT MEFs were infected with MHV68 at an MOI of 1, total RNA was isolated from infected cells harvested at the indicated time points and subjected to qRT-PCR analyses with specific primers corresponding to IL16 and MHV68 ORF50 gene. The relative RNA amount was normalized to GAPDH in each sample. Histograms represented the mean of three independent biological replicates ±SD, p value was determined by two-tailed unpaired t-test, p≤ 0.05 represents significance.

