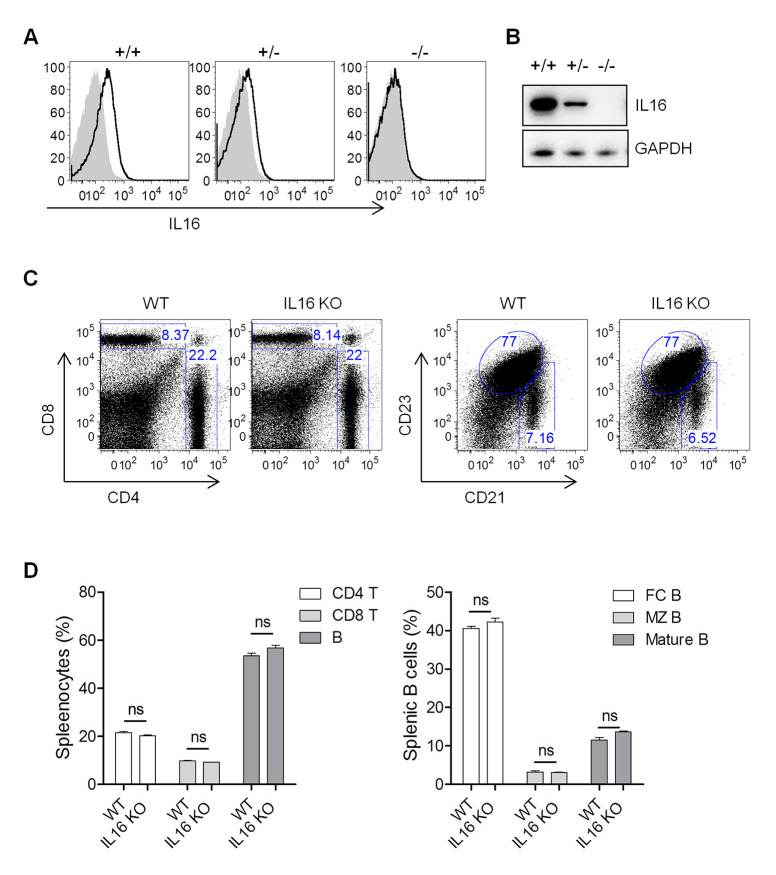
Fig 2. IL16 KO mice show normal B cell development.
(A) Intracellular staining of IL16 in splenocytes isolated from IL16+/+, IL16+/-, and IL16-/- mice. (B) Immunoblot detection of IL16 expression in splenocytes isolated from IL16+/+, IL16+/-, and IL16-/- mice. (C) Representative flow plots showed flow cytometric analyses of splenocytes from IL16+/+ (WT) and IL16-/- (KO) mice. (D) The statistic analyses of CD4+ T, CD8+ T, and B cells (Left panel); follicular (FC) B, marginal zone (MZ) B, and mature B cells (Right panel) in splenocytes from WT and IL16 KO mice. Histograms represented mean ±SD of 8 individual mice (two experiments, n = 4 for each experiment). ns = not significant.

