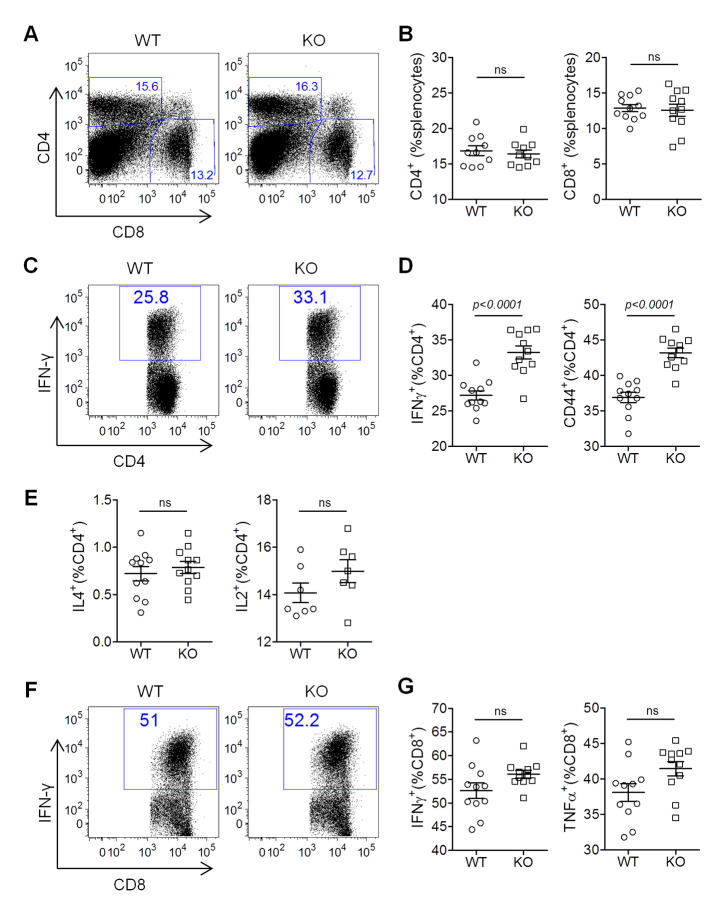
Fig 8. IL16 deficiency increases CD4 T cell activation and IFN-γ-expressing Th1 subset.
WT and IL16 KO mice were inoculated intranasally with 5×10⁴ PFU of MHV68-H2bYFP. Splenocytes were isolated at day 16 post-infection and subjected to flow cytometry analyses. (A) Representative flow plots of CD4+ and CD8+ T cells from infected WT and IL16 KO mice. (B) Quantitation of the percentage of CD4+ and CD8+ T cells. Each symbol represented an individual mouse, and the horizon lines represented the mean frequency. (C) Representative flow plots of IFN-γ+CD4+ T cells from infected WT and IL16 KO mice. (D) Quantitation of the percentage of IFN-γ+CD4+ and CD44+CD4+ T cells. Each symbol represented an individual mouse, and the horizon lines represented the mean frequency. (E) Quantitation of the percentage of IL4+CD4+ and IL2+CD4+ T cells. Each symbol represented an individual mouse, and the horizon lines represented the mean frequency. (F) Representative flow plots of IFN-γ+ CD8+ T cells from infected WT and IL16 KO mice. (G) Quantitation of the percentage of IFN-γ+CD8+ and TNF-α+CD8+ T cells. Each symbol represented an individual mouse, and the horizon lines represented the mean frequency. ns = not significant. p value was determined by two-tailed unpaired t-test, p≤ 0.05 represents significance.

