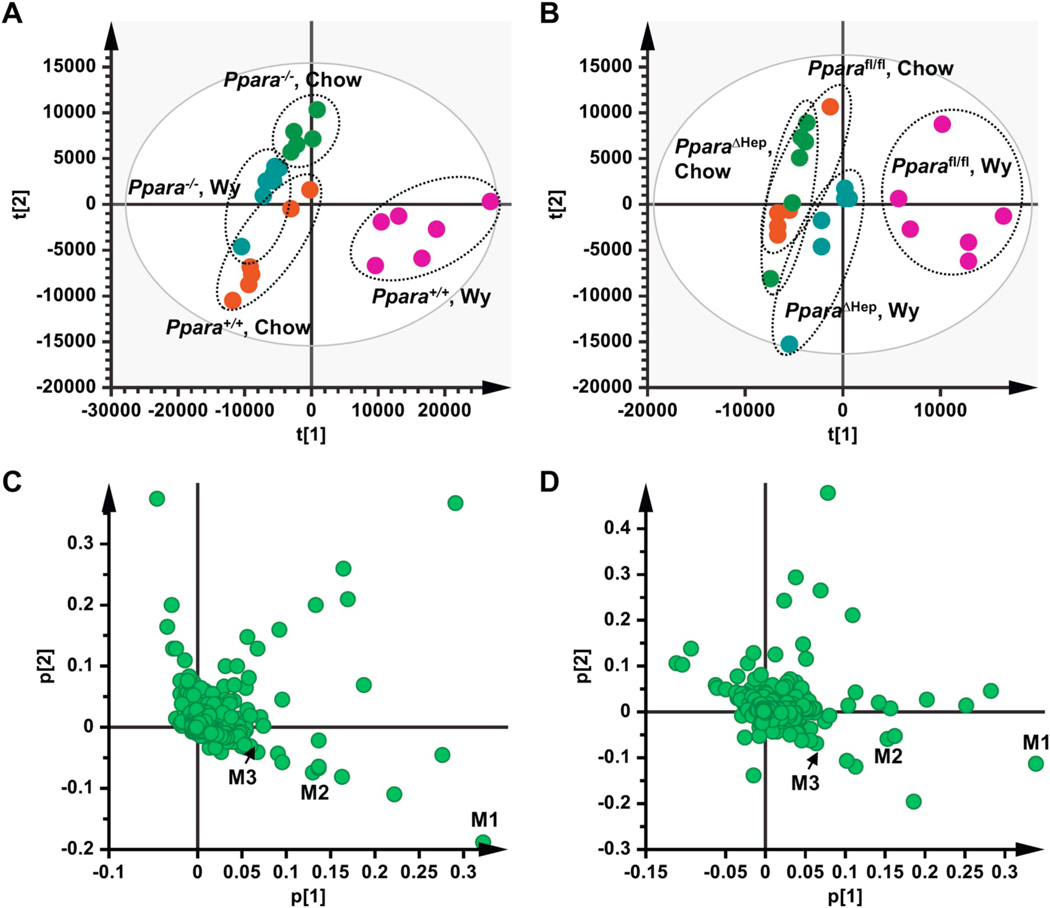
Fig. 1.
Multivariate data analysis and metabolite identification in serum of chow- and Wy-treated mice by UPLC-Q/TOFMS analysis. A. Scores plot of serum metabolome in chow- and Wy-treated Ppara+/+ and Ppara−/− mice as determined by PCA. B. Scores plot of serum metabolome in chow- and Wy-treated Pparafl/fl and PparaΔHep mice as determined by PCA. C. Loading scatter plot for PCA of serum metabolome in the chow- and Wy-treated Ppara+/+ and Ppara−/− mice. D. Loading scatter plot for PCA of serum metabolome in the chow- and Wy-treated Pparafl/fl and PparaΔHep mice. Each point represents an individual mouse serum sample (A, B) or unique ion (C, D). Ions labeled M1–M3 contribute to agonist-dependent PCA separation. The t[1] and t[2] correspond to principal components 1 and 2, respectively. The p[1] values represent the relative abundance of the ions and p[2] values represent the interclass difference. n = 6/group.

