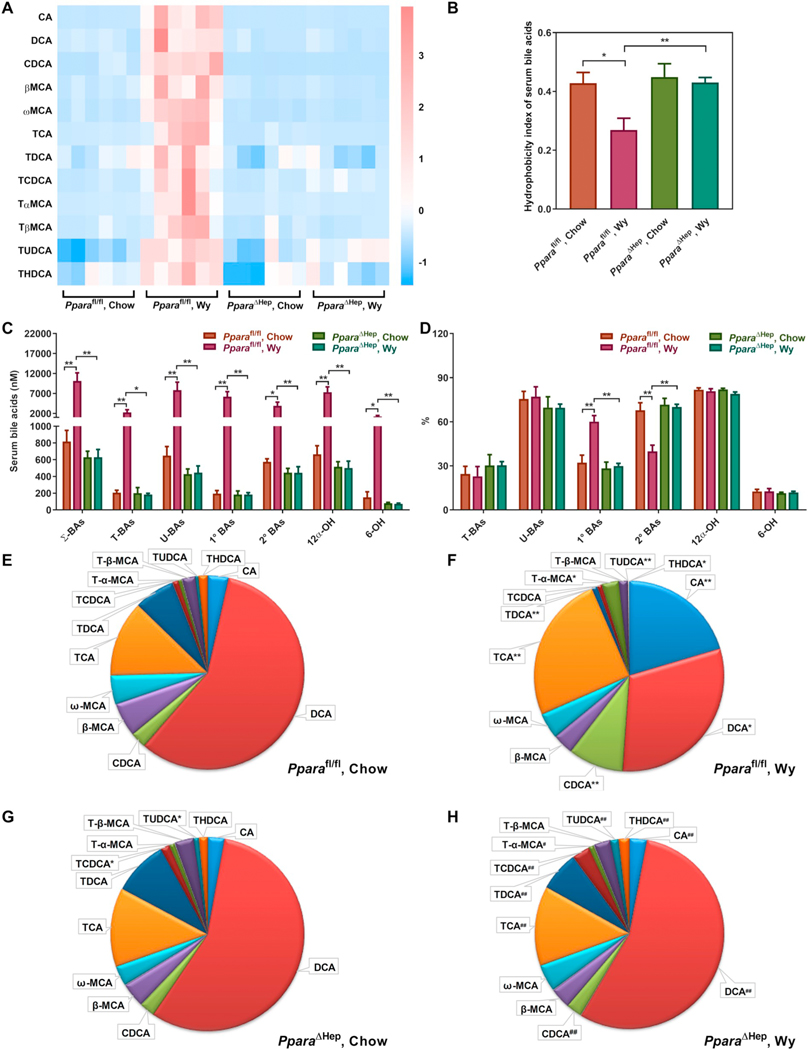
Fig. 2.
Effect of Wy on serum BA composition in Pparafl/fl and PparaΔHep mice. A. Heat map of individual BA levels. B. Hydrophobicity index of serum bile acids. C. Total concentration of different BA classes. D. Relative percentage of different BA classes to total BAs. E. Relative fraction of individual BAs in serum of chow-treated Pparafl/fl mice. F. Relative fraction of individual BAs in serum of Wy-treated Pparafl/fl mice. G. Relative fraction of individual BAs in serum of Chow-treated PparaΔHep mice. H. Relative fraction of individual BAs in serum of Wy-treated PparaΔHep mice. Σ-BAs, total BAs. T-BAs, taurine-conjugated BAs. U-BAs, unconjugated BAs. 1° BAs, primary BAs. 2° BAs, secondary BAs. 12α-OH, 12α-hydroxylated BAs. 6-OH, 6-hydroxylated BAs. Data are presented as mean ± SEM; n = 6/group. *P < 0.05 or **P < 0.01, by one-way ANOVA followed by Tukey’s post-hoc correction.

