FIGURE 1.

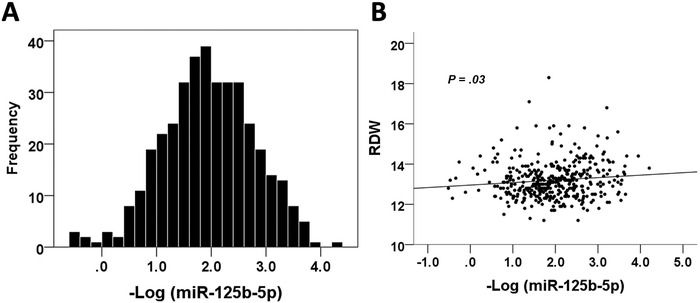
(A) Frequency distribution plot of circulating miR‐125b levels among study participants. (B) The correlation plot between minus log‐transformed miR‐125b level and RDW levels. RDW, red cell distribution width

(A) Frequency distribution plot of circulating miR‐125b levels among study participants. (B) The correlation plot between minus log‐transformed miR‐125b level and RDW levels. RDW, red cell distribution width