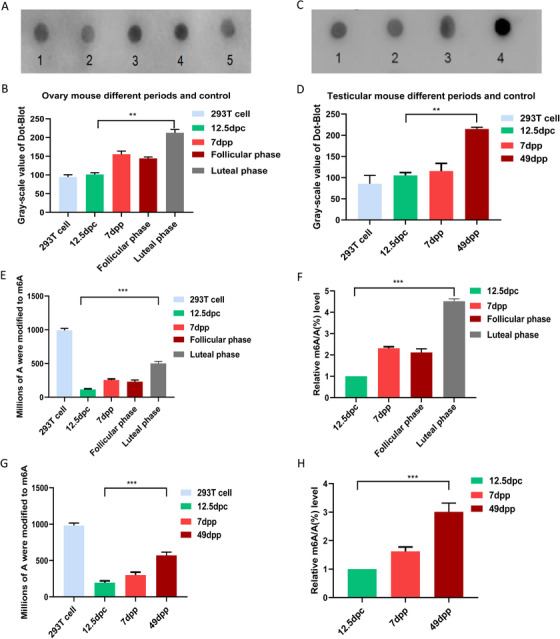
FIGURE 1.

Quantitative analysis of m6A in genital ridges/ovaries/testes of different stages. A, Dot‐blot hybridization in genital ridges/ovaries of different stages. A1‐A5 were 200 ng samples of 293T cell, 12.5 dpc genital ridge, 7dpp ovary, luteal phase ovary, follicular phase ovary. (B) Gray value statistics of m6A in genital ridges/ovaries of different stages. C, Dot‐blot hybridization in genital ridges/ testes of different stages. C1‐C4 were 200 ng samples of 293T cell, 12.5 dpc male genital ridge, 7 dpp testis, and 49 dpp testis. (D) Gray value statistics of m6A in genital ridges/testes of different stages. 293T cells as positive control group. **P < .01, n = 3. E and F, LC‐MS quantitative analysis of m6A in genital ridges/ovaries of different stages. G and H, LC‐MS quantitative analysis of m6A in genital ridges/testes of different stages. 293T cells were used as positive control. E and G, The ordinate represents the number of m6A in a million A. F and H, The ordinate represents the ratio of m6A to A. ***P < .001, n = 6
