
FIGURE 4.
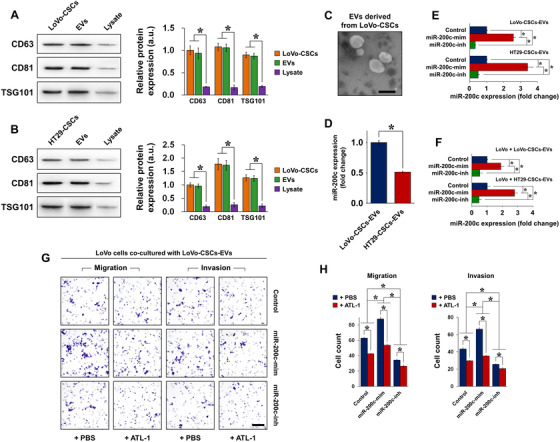
Isolation and characterization of CSC‐derived EVs as a carrier of miR‐200c. A, Expression of exosomal markers CD63, CD81, and TSG101 was detected in LoVo‐CSCs, EVs isolated from LoVo‐CSCs, and cell lysates after isolation. B, Expression of exosomal markers CD63, CD81, and TSG101 was detected in HT29‐CSCs, EVs isolated from HT29‐CSCs, and cell lysates after isolation. In both cases, the lysates of the CSCs showed negligible expression of these markers compared to that in CSCs and CSC‐derived EVs. C, Transmission electron microscopy of EVs derived from LoVo‐CSCs (scale bar = 200 nm). D, Comparison of the relative basal expression of miR‐200c in EVs derived from nontransfected LoVo‐CSCs and HT29‐CSCs. LoVo‐CSCs‐EVs expressed higher levels of miR‐200c than did HT29‐CSCs‐EVs. E, Expression of miR‐200c in EVs derived from LoVo‐CSCs or HT29‐CSCs that were first transfected with miR‐200c mimics (miR‐200cmim) or inhibitors (miR‐200c‐inh). EVs derived from nontransfected CSCs are denoted as Control. miR‐200c‐mim and miR‐200c‐inh, respectively, induced significant upregulation and downregulation of miR‐200c in both LoVo‐CSCs‐EVs and HT29‐CSCs‐EVs relative to Control levels. F, Expression of miR‐200c in LoVo cells co‐cultured with LoVo‐CSCs‐EVs and HT29‐CSCs‐EVs (CSCs were subjected to various transfections). Transfection of CSCs with miR‐200c‐mim and miR‐200c‐inh resulted in the secretion of EVs that, respectively, induced significant upregulation and downregulation of miR‐200c in LoVo cells relative to Control levels. G, Transwell assay of the migration and invasion of LoVo cells co‐cultured with LoVo‐CSCs‐EVs (CSCs were subjected to various transfections), with or without ATL‐1 administration at 200 μM. Relative to Control levels, migration and invasion were enhanced by EVs derived from miR‐200c‐mim‐transfected CSCs, but suppressed by those derived from miR‐200c‐inh‐transfected CSCs. In all cases, ATL‐1 reduced the degree of migration and invasion. Scale bar = 50 μm. H, Quantification of the data in (F) by cell count. The data represent the mean ± SD of three independent technical replicates (t‐test or ANOVA) * P < .05