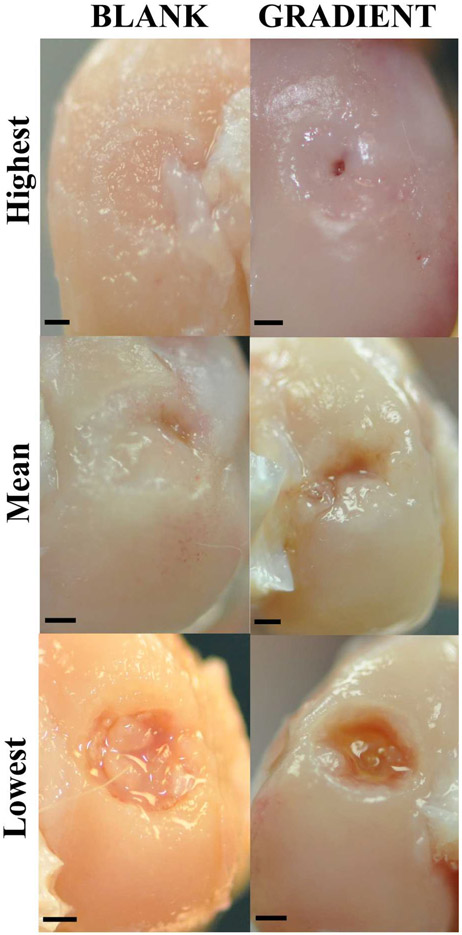
Figure 4.
Representative images for gross morphology of the BLANK and GRADIENT groups at 12 weeks postimplantation. The top row represents images from the implants that received the highest morphological score (BLANK, 8; GRADIENT, 8.7). The middle row represents images from the implants that received the mean morphological score (BLANK, 6; GRADIENT, 5.2). The bottom row represents images from the implants that received the lowest morphological score (BLANK, 3.3; GRADIENT, 1.3). The BLANK group performed better in percent defect fill, whereas the GRADIENT group performed better in edge integration with the native tissue. Scale bars: 1 mm.

