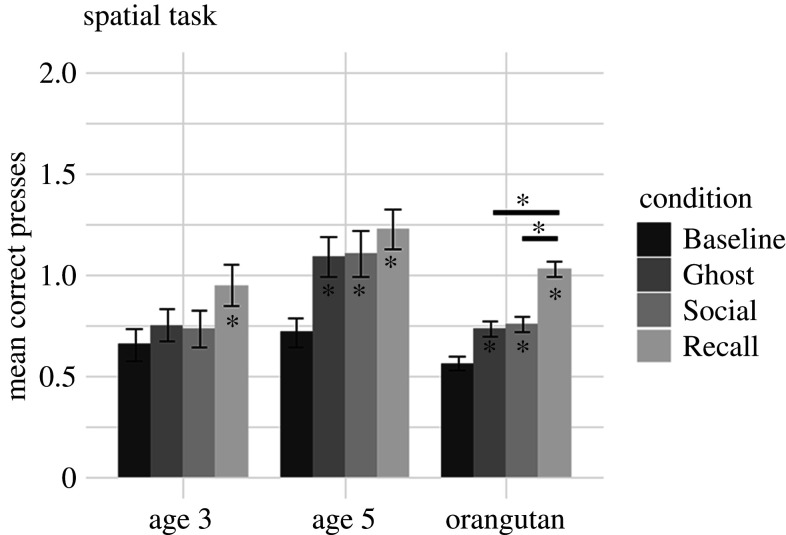
Figure 3.
Summary of child and orangutan performance in the spatial task by condition. Asterisks inside of the bars denote a condition in which performance was better than Baseline for that group; horizontal lines and asterisks above the bars indicate which conditions are significantly different from each other. The y-axis shows the first variable in the CI measure (mean correct presses). For all participants, this statistic was for up to the first four trials in a condition. Error bars indicate s.e.

