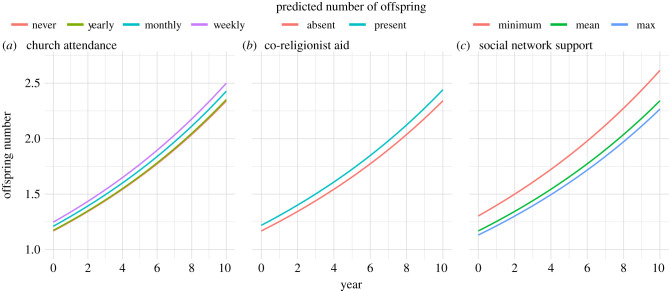
Figure 3.
Key predictors of mothers fertility over 10 years of the study: (a) illustrates predicted number of children among mothers by mother's church attendance; (b) illustrates the predicted number of children depending on whether mothers receive aid from co-religionists; and (c) illustrates predicted number of children by social network support; minimum shows the predicted number of children for the lowest observed level of social network support found in our dataset; mean illustrates the predicted number of children for the mean level of social network support observed in our dataset, and maximum illustrates the predicted number of children for the highest level of social network support observed in our dataset. All three of these figures are based on the coefficients estimated electronic supplementary material, table S5.

