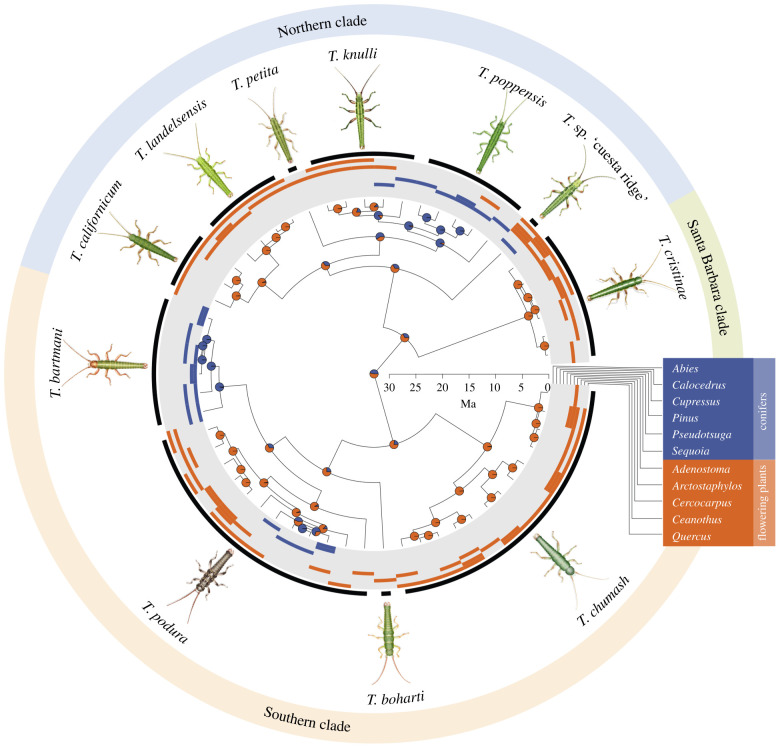
Figure 3.
Timema species phylogenetic relationships and host-plant use, including ancestral use inferences using conifers and flowering plants as states. The bars on the periphery depict the host-plant use of each population. The pie charts on the internal nodes represent the proportional likelihoods of conifers (blue) and flowering plants (orange) for reconstructed ancestral states. Ma, million years.

