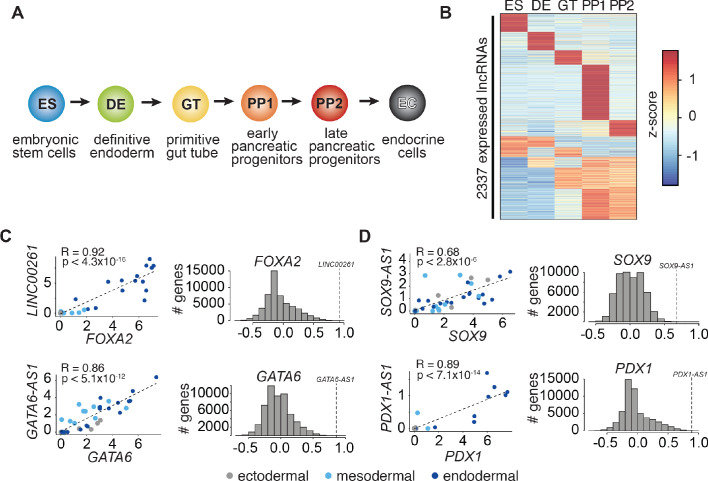
Figure 1. LncRNA expression and regulation during pancreatic differentiation.
(A) Stages of directed differentiation from human embryonic stem cell (hESCs) to hormone-producing endocrine cells. The color scheme for each stage is used across all figures. (B) K-means clustering of all lncRNAs expressed (RPKM ≥ 1) during pancreatic differentiation based on their expression z-score (mean of n = 2 independent differentiations per stage; from CyT49 hESCs). (C,D) Left: Scatterplots comparing the expression of early (C) and late (D) expressed endodermal transcription factors (TFs) with the expression of their neighboring lncRNAs across 38 tissues. The dot color indicates the germ layer of origin of these tissues. Pearson correlation coefficients and p-values (t-test) are displayed. Right: Distribution of the Pearson correlation coefficients for each TF with all Ensembl 87 genes across the same 38 tissues. Dashed lines denote the correlation for the neighboring lncRNA, which for all lncRNAs shown is higher than expected by chance. See also Figure 1—figure supplement 1 and Figure 1—source data 1.


