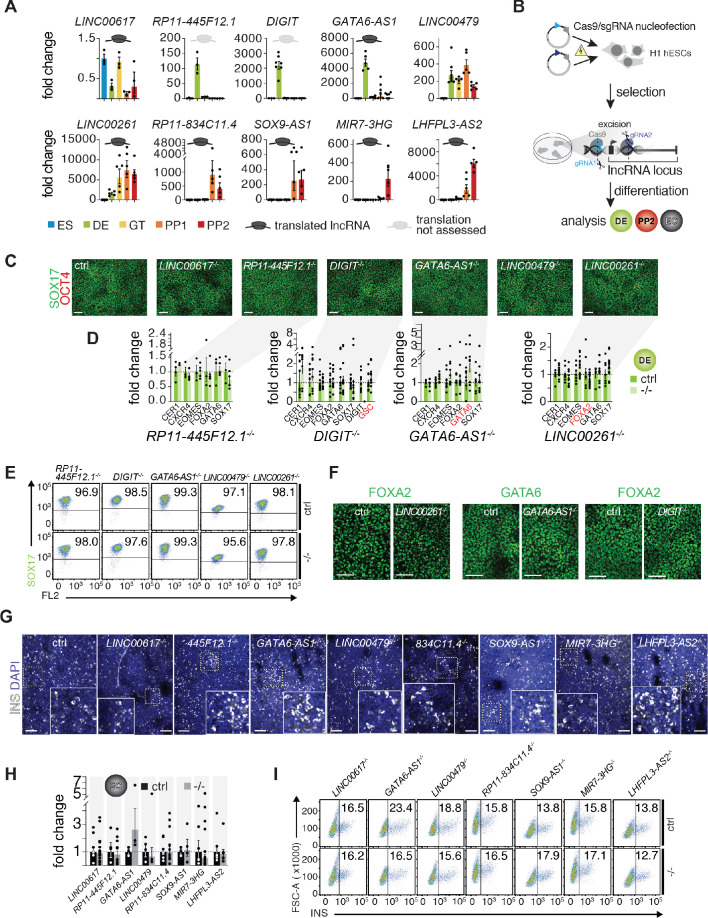
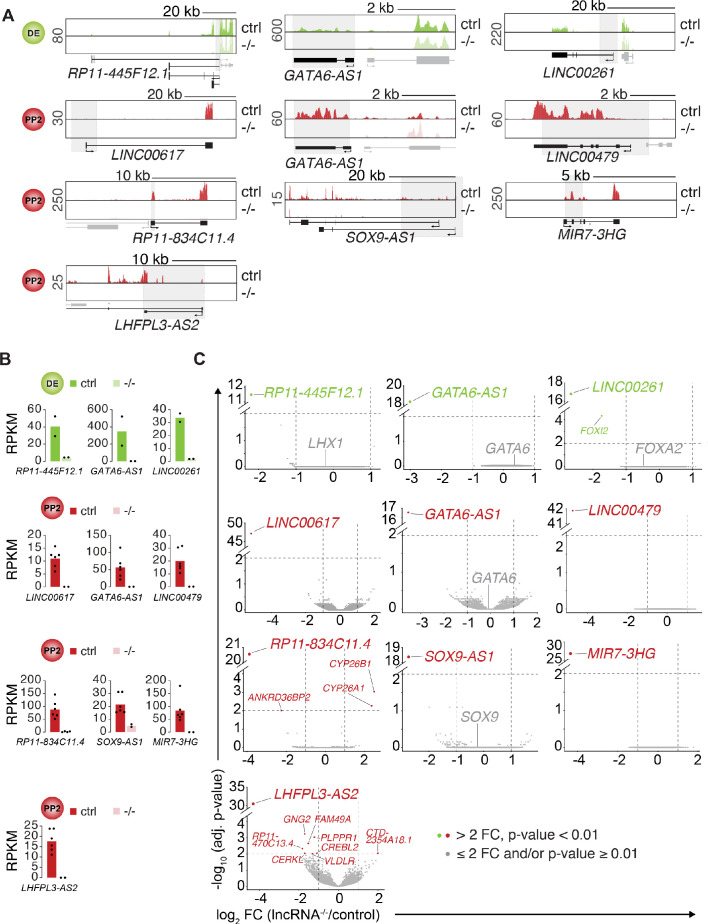
Figure 3. A small-scale CRISPR loss-of-function screen for dynamically expressed and translated lncRNAs during pancreatic differentiation.
(A) qRT-PCR analysis of candidate lncRNAs during pancreatic differentiation of H1 hESCs relative to the ES stage. Data are shown as mean ± S.E.M. (mean of n = 2–6 independent differentiations per stage; from H1 hESCs). Individual data points are represented by dots. See also Figure 3—source data 2. (B) CRISPR-based lncRNA knockout (KO) strategy in H1 hESCs and subsequent phenotypic characterization. (C) Immunofluorescence staining for OCT4 and SOX17 in DE from control (ctrl) and KO cells for the indicated lncRNAs (representative images, n ≥ 3 independent differentiations; at least two KO clones were analyzed). (D) qRT-PCR analysis of DE lineage markers in DE from control and lncRNA KO (-/-) cells. TF genes in cis to the lncRNA locus are highlighted in red. Data are shown as mean ± S.E.M. (n = 3–16 replicates from independent differentiations and different KO clones). Individual data points are represented by dots. NS, p-value>0.05; t-test. See also Figure 3—source data 3. (E) Flow cytometry analysis at DE stage for SOX17 in control and KO (-/-) cells for indicated lncRNAs. The line demarks isotype control. Percentage of cells expressing SOX17 is indicated (representative experiment, n ≥ 3 independent differentiations from at least two KO clones). (F) Immunofluorescence staining for FOXA2 or GATA6 in DE from control and LINC00261, GATA6-AS1, and DIGIT KO cells. (G) Immunofluorescence staining for insulin (INS) in endocrine cell stage (EC) from control and KO hESCs for the indicated lncRNAs (representative images, n ≥ 3 independent differentiations from at least two KO clones). Boxed areas (dashed boxes) are shown in higher magnification. (H) qRT-PCR analysis of INS in EC stage cultures from control and lncRNA KO (-/-) hESCs. Data are shown as mean ± S.E.M. (n ≥ 4 replicates from independent differentiations of at least two KO clones). Individual data points are represented by dots. NS, p-value>0.05; t-test. See also Figure 3—source data 4 (I) Flow cytometry analysis at EC stage for INS in control and KO (-/-) cells for indicated lncRNAs. The line demarks isotype control. Percentage of cells expressing insulin is indicated (representative experiment, n ≥ 3 independent differentiations each from at least two KO clones). Scale bars = 100 µm. See also Figure 3—figure supplement 1 and Figure 3—source data 1–4.


