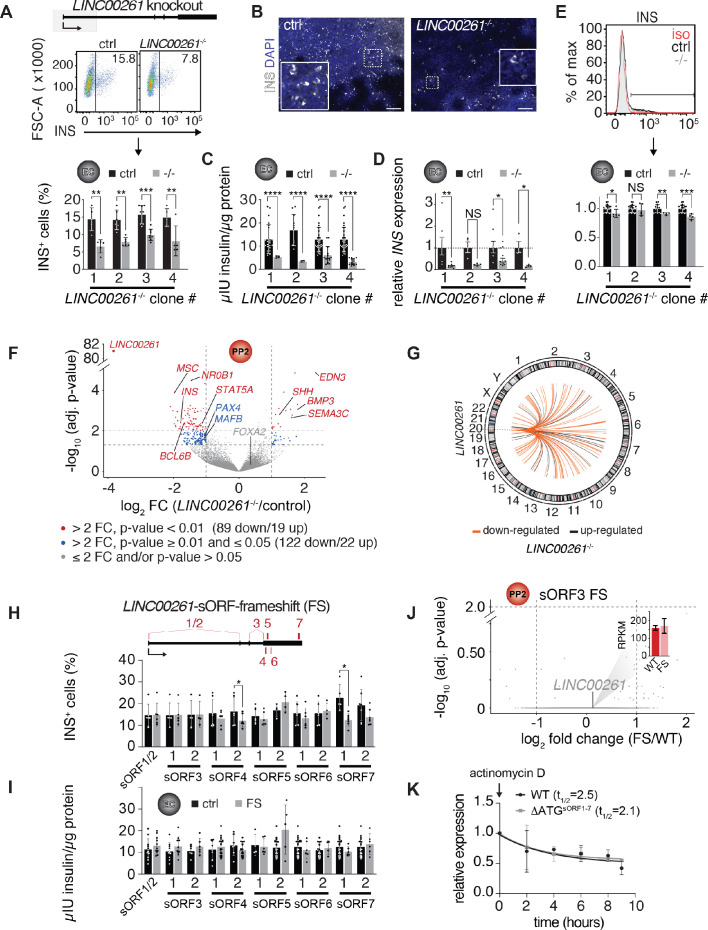
Figure 4. LINC00261 deletion impedes pancreatic endocrine cell differentiation.
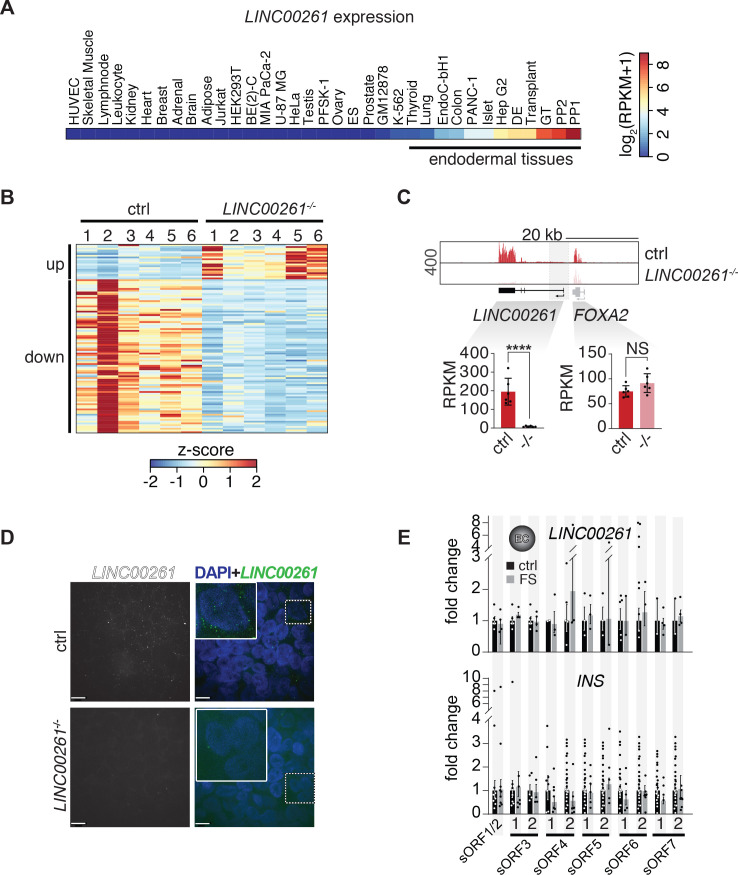
(A) Flow cytometry analysis at endocrine cell stage (EC) for insulin (INS) in control (ctrl) and LINC000261-/- H1 hESCs. Top panel: Schematic of the LINC00261 locus. The dashed box represents the genomic deletion. Middle panel: The line demarks isotype control. Percentage of cells expressing INS is indicated (representative experiment, n = 4 deletion clones generated with independent sgRNAs). Bottom panel: Bar graph showing percentages of INS-positive cells. Data are shown as mean ± S.D. (n = 5 (clone 1), n = 6 (clone 2), n = 8 (clone 3), n = 5 (clone 4) independent differentiations). Individual data points are represented by dots. (B) Immunofluorescence staining for INS in EC stage cultures from control and LINC000261-/- hESCs (representative images, number of differentiations see A). Boxed areas (dashed boxes) are shown in higher magnification. (C) ELISA for INS in EC stage cultures from control and LINC00261-/- hESCs. Data are shown as mean ± S.D. (n = 3 (clone 1), n = 2 (clone 2), n = 14 (clone 3), n = 13 (clone 4) independent differentiations). Individual data points are represented by dots. (D) qRT-PCR analysis of INS in EC stage cultures from control and LINC00261-/- hESCs. Data are shown as mean ± S.E.M. (n = 8 (clone 1), n = 4 (clone 2), n = 10 (clone 3), n = 3 (clone 4) independent differentiations). Individual data points are represented by dots. (E) Quantification of median fluorescence intensity after INS staining of control and LINC00261-/- EC stage cultures. Data are shown as mean ± S.D. (n = 5 (clone 1), n = 5 (clone 2), n = 4 (clone 3), n = 4 (clone 4) independent differentiations). iso, isotype control. Individual data points are represented by dots. (F) Volcano plot displaying gene expression changes in control versus LINC00261-/- PP2 cells (n = 6 independent differentiations from all four deletion clones). Differentially expressed genes are shown in red (DESeq2;>2 fold change (FC), adjusted p-value<0.01) and blue (>2 fold change, adjusted p-value≥0.01 and≤0.05). Thresholds are represented by vertical and horizontal dashed lines. FOXA2 in cis to LINC00261 is shown in gray (gray dots represent genes with ≤ 2 fold change and/or adjusted p-value>0.05). (G) Circos plot visualizing the chromosomal locations of the 108 genes differentially expressed (DESeq2;>2 fold change (FC), adjusted p-value<0.01) in LINC00261-/- compared to control PP2 cells, relative to LINC00261 on chromosome 20. No chromosome was over- or underrepresented (Fisher test, p-value>0.05 for all chromosomes). (H) Top panel: Schematic of the LINC00261 locus, with the location of its sORFs (1 to 7) marked by vertical red bars. Bottom panel: Flow cytometric quantification of INS-positive cells in control and LINC00261-sORF-frameshift (FS) at the EC stage. Data are shown as mean ± S.D. (n = 4–7 independent differentiations per clone). (I) ELISA for INS in EC stage cultures from control and LINC00261-sORF-FS hESCs. Data are shown as mean ± S.D. (n = 3–7 independent differentiations per clone). (J) Volcano plot displaying gene expression changes in control versus LINC00261-sORF3-FS PP2 cells. No gene was differentially expressed (DESeq2;>2 fold change, adjusted p-value<0.01; indicated by dashed horizontal and vertical lines; n = 2 independent differentiations). LINC00261 is shown in gray, the bar graph insert displays LINC00261 RPKM values in control and LINC00261-sORF3-FS PP2 cells. (K) LINC00261 half-life measurements in HEK293T cells transduced with lentivirus expressing either wild type (WT) LINC00261 or ΔATGsORF1-7 LINC00261 (mutant in which the ATG start codons of sORFs 1–7 were changed to non-start codons). HEK293T were treated with the transcription inhibitor actinomycin D and RNA isolated at 0, 2, 4, 6, 8, and 9 hr post actinomycin D addition. LINC00261 expression was analyzed by qRT-PCR relative to the TBP gene. Data are shown as mean ± S.E.M. (n = 3 biological replicates for each assay time point). *, p-value<0.05; **, p-value<0.01; ***, p-value<0.001; ****, p-value<0.0001; NS, p-value>0.05; t-test. Scale bars = 100 µm. See also Figure 4—figure supplement 1 and Figure 4—source data 1–3.


