. 2020 Aug 4;9:e57268. doi: 10.7554/eLife.57268

Figure 3. Tuning of vTT cells to distinct behaviors in the odor-guided eating/no-eating task.

(A) Schematic of the odor-guided eating/no-eating task, with behavioral epochs progressing from left to right. (B) Left panel: examples of event-aligned spike data for three representative cells tuned to specific behaviors. The event-aligned spike histograms were calculated using a 500 ms bin width and smoothed by convolving spike trains with a 500 ms wide Gaussian filter. Gray shading indicates the approach epoch (from the start of approach behavior to contacting the dish), pink shading indicates the eating epoch (from the start of consumption to food removal), and light green shading indicates the food removal epoch (2 s after food removal). Right panel: auROC values calculated from event-aligned spike data (aligned to contacting the dish) for all cells, sorted by the timing of the peak of auROC values. Each row corresponds to one cell. auROC values were calculated by comparing eating trials versus baseline (pre-approach period, 3 to 1 s before starting approach behavior) in the sliding bins (width, 500 ms; step, 100 ms). Vertical white lines indicate when the animal touched the dish (left) and when the food was removed (right). The color scale indicates positive values that reflect increases in firing rate relative to baseline, while negative values reflect firing rate decreases relative to baseline. (C) Relative distribution of the significant auROC values (p<0.01, permutation test) in each cell group tuned to a specific behavior in the odor-guided eating/no-eating task. The cell groups were tuned to approach epoch, eating epoch, and food removal epoch (from bottom to top of graph). Each line corresponds to one cell (left axes, auROC values). Yellow and blue indicate a significant increase and decrease from baseline, respectively; gray indicates a non-significant increase or decrease. Shaded regions indicate the relative distribution of significant auROC valves (right axes, probability, see Materials and methods). Red dots indicate that a time bin contained more cells with significant responses than that in the distribution of 1000 resampling datasets. Blue dots indicate that a time bin contained fewer cells with significant responses than that in the distribution of 1000 resampling datasets. The resampling datasets are provided in the Figure 3—source data 1. Vertical black lines indicate when mice contacted the dish (left) and when food was removed (right). Note that each cell group had an excitatory response to a specific behavioral epoch, with suppressed responses relative to other epochs.

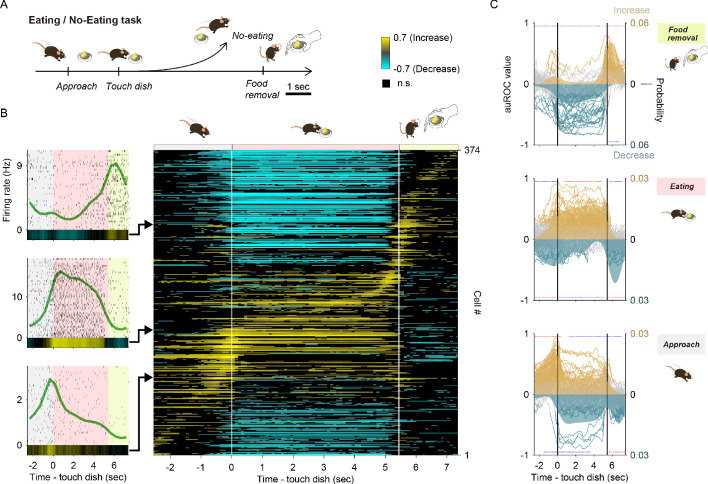
Figure 3—source data 1. Source data of the relative distributions of significant neural responses in eating/no-eating task.

Figure 3.

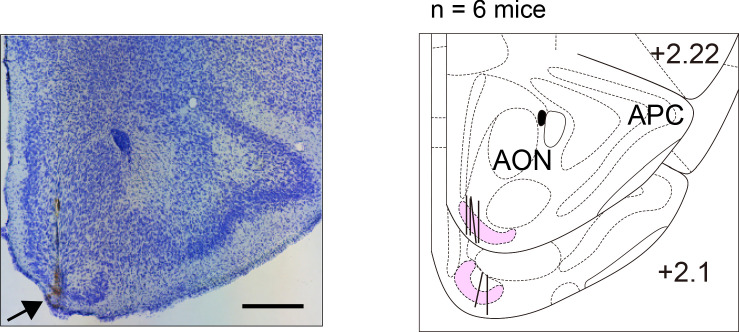
Figure 3—figure supplement 1. vTT recording sites across mice in the odor-guided eating/no-eating task.

Figure 3—figure supplement 1.

Nissl-stained frontal section (arrow indicates recording track) and recording tracks (vertical thick lines) of the vTT in the odor-guided eating/no-eating task. The pink area shows layer II of the vTT. APC, anterior piriform cortex; AON, anterior olfactory nucleus. Scale bar, 500 μm.
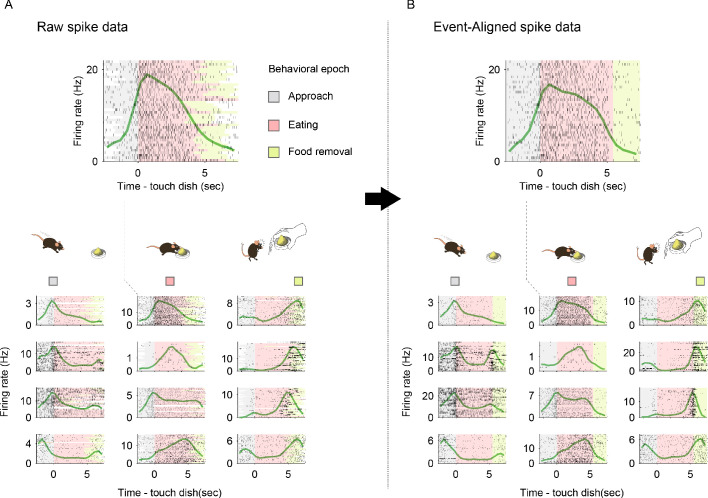
Figure 3—figure supplement 2. Representative activity patterns of behavior-specific active vTT cells in the odor-guided eating/no-eating task.

Figure 3—figure supplement 2.

(A) Examples of spike data tuned to specific behaviors. Spike histograms (green line) were calculated using a 500 ms bin width and smoothed by convolving spike trains with a 500 ms wide Gaussian filter. Gray shading indicates the approach epoch (from the start of approach behavior to contacting the dish), pink shading indicates the eating epoch (from the start of eating behavior to food removal), light green shading indicates the food removal epoch (2 s after food removal). (B) Same as (A) for event-aligned spike data, derived by linearly scaling time intervals between behavioral epochs in each trial to the median interval across eating trials. Numbers of spikes between epochs are preserved. Data presented are from the same cells and in the same order as those in (A).
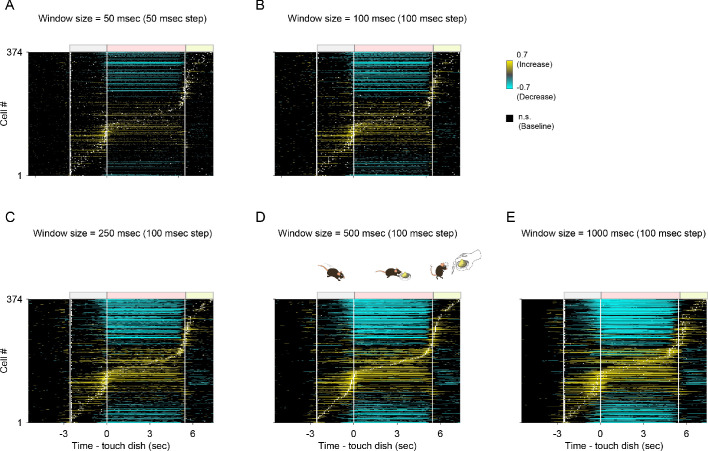
Figure 3—figure supplement 3. Dependence of auROC values on window size in the odor-guided eating/no-eating task.

Figure 3—figure supplement 3.

auROC values calculated during the odor-guided eating/no-eating task in sliding bins of (A) width, 50 ms; step, 50 ms; (B) width, 100 ms; step, 100 ms; (C) width, 250 ms; step, 100 ms; (D) width, 500 ms; step, 100 ms (as in Figure 3B); and (E) width 1000 ms; step, 100 ms. White dots indicate peaks of auROC values. Vertical white lines indicate transitions between behavioral epochs.
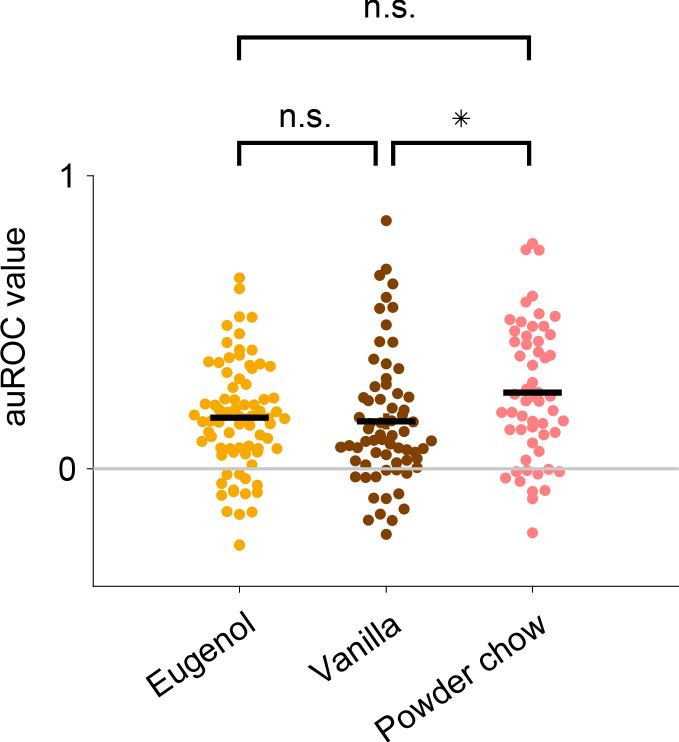
Figure 3—figure supplement 4. Eating epoch activity during eugenol, vanilla essence, and powder chow presentation in the odor-guided eating/no-eating task.

Figure 3—figure supplement 4.

Mean auROC values during the eating epoch for each cell which had a tuning peak time during the eating epoch (eugenol presentation, n = 76 cells; vanilla essence presentation, n = 67 cells; powder chow presentation, n = 55 cells). Only cells with a minimum number of 10 trials for each condition were included in these data. Statistical significance among three groups (*p<0.05) was assessed using one-way analysis of variance (ANOVA).