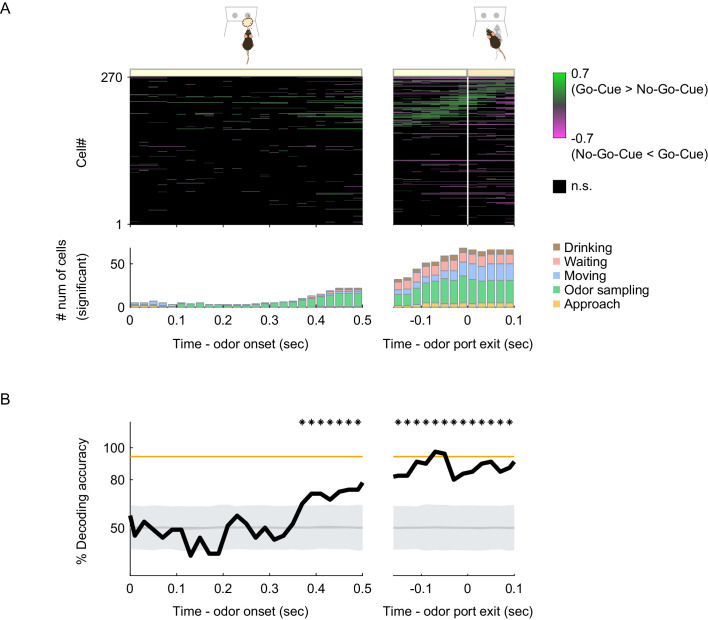
Figure 5. Behavioral context-specific activity of vTT cells.
(A) Upper panel: auROC values for all cells around the odor sampling epoch in the odor-guided go/no-go task. Each row corresponds to one cell. auROC values (left, aligned to the odor valve opening; right, aligned to the odor port exit) were calculated for correct go trials versus correct no-go trials in sliding bins (width, 100 ms; step, 20 ms). These values were sorted based on the time of peak auROC values in the right graph. The vertical white line indicates the time of odor port exit. The color scale indicates significant auROC values (p<0.01, permutation test). The black boxes indicate bins with non-significant auROC values. Lower panel: the number of cells that exhibited significant auROC values (p<0.01, permutation test) for each time bin (orange, cell group tuned to the approach epoch; green, odor sampling epoch; blue, moving epoch; red, waiting epoch; brown, drinking epoch). (B) The time course of odor decoding accuracy in the odor-guided go/no-go task. A vector consisting of instantaneous spike counts for 270 neurons in a sliding window (width, 100 ms; step, 20 ms) was used as input for the classifier. Training of the classifier and testing were performed at every time point. The orange line indicates the level of behavioral performance. The gray line and shaded area indicate the mean ± 2 SD of control decoding accuracies calculated from 1000 trial-label-shuffled datasets. The shuffled datasets are provided in the Figure 5—source data 1. Top asterisks indicate accuracies greater than the mean + 2SD.

